Test Controller, Automatic testing a battery with USB charging
This article explains a script to test USB charging on a battery and generate a final curve that shows the result.
I hope it can be used as inspiration to make your own test scripts.
Contents
Test setup
Script
Prefix for menu
Preparing
Testing
Charting
Manually setting up a chart
Chart setup routine
Notes & download
Functions for use in scripting etc.
Main page
Test setup
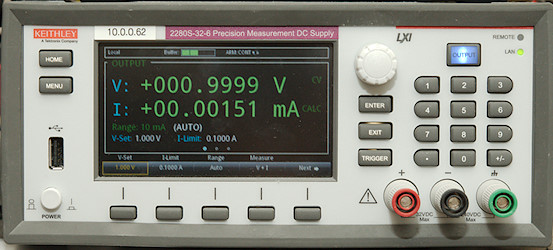
I want the test to discharge the battery and then charge it from USB while monitoring battery voltage and USB current.
For this I use a power supply to supply the USB voltage and a electronic load to discharge battery and measure battery voltage. The battery is mounted in one of my 4-terminal battery holders.
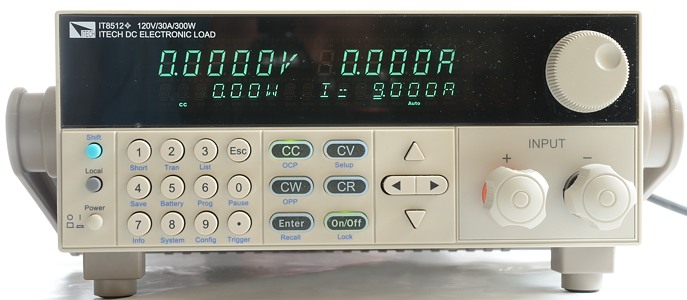
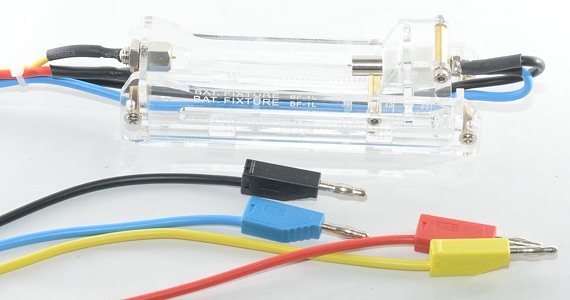
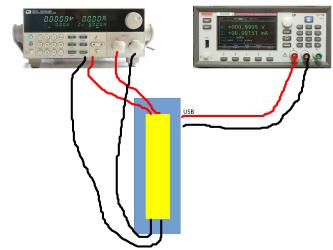
To always remember the setup I have made a very simple drawing that TC will show when I select the test.
Script
Prefix for menu
Code:
#scriptMenu Batteries;Test;USB charging
#scriptInterface Load setCurrent setOn readVoltage
#scriptInterface ps setCurrent setOn setVoltage readCurrent
#scriptShowImage D:\Devlop\lygte-info\pic\Projects\TestController\DocImage\TestSetup.png
#autorun
When scripts are store for use in menus there are a couple of prefix lines, most of them optional.
#scriptMenu is requried and names the script
#scriptInterface list what device I want to use and also list what interfaces must be supported
#scriptShowImage will show the image of the test setup when script is selected.
#autorun start script immediately, do not copy it into the log window.
The #scriptInterface works as a filter and the script will only show up in the menu when the listed devices are available.
I could also have defined exactly what devices I wanted and then done a "Reconnect" from the script, but this way means I can select any load and power supply, just by loading them first.
Preparing
I do not want a list of the script when using it.
Code:
=var terminationCurrent=0.01
=var dischargeCurrent=0.5
=var minimumVoltage=2.8
I need some values depending on battery size and chemistry, here I create them as variables and initialize them for a small LiIon battery.
Code:
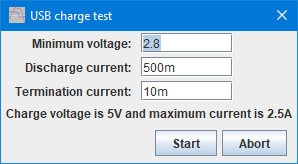
#popupInit "USB charge test"
#popupNumber "Minimum voltage" minimumVoltage 0.5 6 "The fully discharged voltage for the battery"
#popupNumber "Discharge current" dischargeCurrent 0.1 2 "Current used for initial discharge"
#popupNumber "Termination current" terminationCurrent 0.01 0.1 "This will define when the charge stops"
#popupLabel "Charge voltage is 5V and maximum current is 2.5A"
#popupButtons Start ok Abort
#popupShow
Make a popup menu where the variables can be adjusted for actual battery type. This popup creates a "ok" variable with the button pressed: "Start"=1 "Abort"=0
I could have done the script without #autorun and then modified the variables in the log window, before running the script.
Code:
#if !ok
="Test aborted"
#return
#endif
If I press "Abort" in the popup window this code will stop the script, without this it would run anyway, but without modifying the variables.
Code:
#log 0
=var ps=getDevice("ps");
=var load=getDevice("load");
Disable any active logging and find the first power supply and load.
Testing
Code:
=setOn(ps,0)
=timestamp()+" Starting to discharge battery"
=setCurrent(load,dischargeCurrent)
=setOn(load,1)
#wait readVoltage(load)>minimumVoltage
=setCurrent(load,dischargeCurrent/5.0)
#delay 30
#wait readVoltage(load)>minimumVoltage
=timestamp()+" Finished discharging battery"
=setOn(load,0)
#delay 2
To discharge the battery I must be sure the power supply is off. Then I configure the load with specified current and start it, I do not log the discharge.
Next I wait while the battery voltage is above the minimum voltage
To really get the battery discharged, I reduce the discharge current to 1/5 and do a round more.
Last part of discharging it turning the load off.
Code:
#math Capacity Ah SumTimeHour 0 (nameCurrent(ps))
#log 1
#hasLogged
=setVoltage(ps,5);
=setCurrent(ps,2.5)
=setOn(ps,1)
#hasLogged
For the actual test I want a Ah curve and I define a Math expression for it.
Next I start logging and to capture the initial battery voltage I wait until one entry has been logged.
Next I turn the power supply on to supply 5V usb power with a maximum of 2.5A
Again I want to be sure I have logged a value
Code:
#hasLogged
#wait readCurrent(ps)>terminationCurrent
=timestamp()+" Charging finished at current: "+readCurrent(ps)+" waiting an hour to see how voltage drops"
#delay (60*60)
=setOn(ps,0)
#delay (60*10)
#log 0
=var d=date()
#savetable ("USB Charge Test "+d)
The actual charge curve start with a #hasLogged to secure the readCurrent() function is completely up to date.
Here I wait while the current is above the termination current.
When current gets lower I charge one hour more to see if the charge really has stopped.
Then I turn the power supply off and do 10 minutes more logging.
Finally I stop the logging and save the data, the filename includes date and time.
Charting
Code:
#runScript USBChargingFormatChart (nameCurrent(ps)) (nameVoltage(load)) Math.Capacity
#chartTitle "USB Charging"
#savechart ("USB Charge Test "+d)
=timestamp()+" Finished charging battery"
This code is very simple, because it do not contain the actual charging code, only a call to it.
I give the chart a title and save it in a file with the same date time as the csv file.
Manually setting up a chart
Sometimes I may want to generate the same chart directly from a csv file, without doing the testing again.
Code:
#scriptMenu Batteries;Test;USB charging format chart
; This script is for manually formatting the data for a USB charging
#autorun
Here is no requirement for devices, only a #autorun tag.
Code:
#logcmds 0
#if (tableRows()<1 || tableColumns()<3)
#POPUPSHOWINFO "No data in table" 3
#RETURN
#endif
Stop the script if no table is present.
Code:
=var psCurrent="K2280.Current";
=var loadVoltage="IT8512.Voltage";
=var mathCapacity="Math.Capacity";
I use variables for the column names, this makes it easy to change them.
Code:
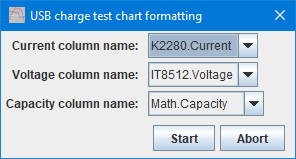
#popupInit "USB charge test chart formatting"
#popupColumn "Current column name" psCurrent 0 .Current
#popupColumn "Voltage column name" loadVoltage 0 .Voltage
#popupColumn "Capacity column name" mathCapacity 0 .Capacity
#popupButtons Start ok Abort
#popupShow
And I show a popup with the selected columns and the possibility to change to other similar columns if any are found in the data.
Code:
#if ok
#runScript USBChargingFormatChart (psCurrent) (loadVoltage) (mathCapacity)
#endif
If I press "Start" in the popup it will call the same charting routine as the test calls, i.e. exactly the same formatting will be used in both cases.
Chart setup routine
This routine is called with the 3 column names it need to setup the chart.
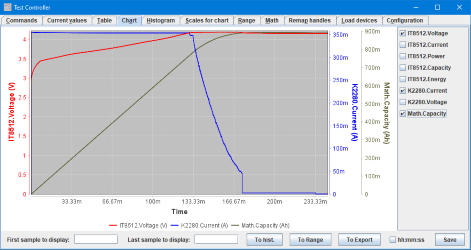
Chart before any of the formatting below is applied.
Code:
#scriptScript USBChargingFormatChart
; The routine do the actual formatting of the chart
=var psCurrent=params[0];
=var loadVoltage=params[1];
=var mathCapacity=params[2];
It uses #scriptScript to stay out of the menus and has a fairly long name to reduce the risk of other stuff using the same name.
I transfer the parameters to variables with more descriptive names.
Code:
#chartCurves (loadVoltage) (psCurrent) (mathCapacity)
#chartColors red green blue
#chartScaleName (loadVoltage) "Battery voltage"
#chartScaleName (psCurrent) "Charge current"
#chartScaleName (mathCapacity) "Charged capacity"
#chartX hhmmss
=var capacity=tableCalcMax(mathCapacity);
=var capacityScale=round((capacity+0.1)*10.0)/10.0;
#scale (loadVoltage) 3 0 0 1 0 0.1 0.1
#scale (psCurrent) 3 1 0 1 0 0.1 0.1
#scale (mathCapacity) 2 1 0 0 0.0 (capacityScale)
#chartBackground lightgreen
Here I select curves, setup colors, define more friendly names for use on the chart, select x-axis scale to show hh:mm:ss, defines the scale parameters for the 3 curves, I do the capacity manually.
Finally I make the chart background light green.
Code:
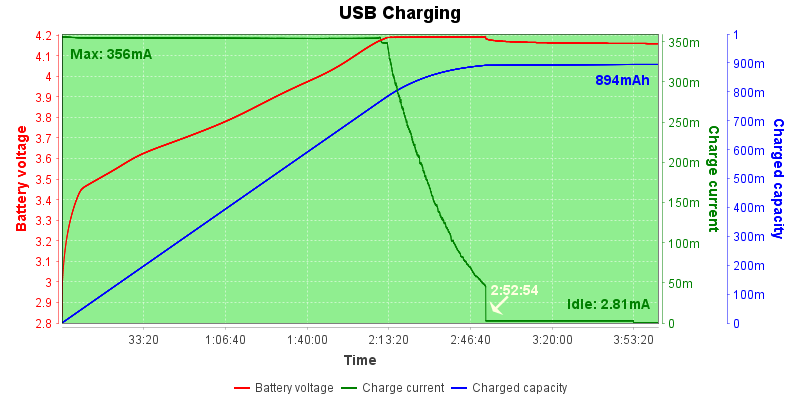
#chartAnnotate +(mathCapacity) text (formatSI(capacity,3)+"Ah ") rt (tableTime()) (capacity*0.98) - 3
=var idleCurrent=tableCalcAvg(psCurrent,tableTime()-30*60,tableTime()-10*60);
#chartAnnotate +(psCurrent) text ("Idle: "+formatSI(idleCurrent,3)+"A ") rb (tableTime()) (idleCurrent*1.02+0.01) - 3
=var maxCurrent=tableCalcMax(psCurrent);
#chartAnnotate +(psCurrent) text (" Max: "+formatSI(maxCurrent,3)+"A") lt (0) (tableCalcMin(psCurrent,1*60,45*60)*0.98) - 3
=var eocIndex=tableValue(idleCurrent*2,psCurrent,60);
=var eocTime=table(eocIndex,"time");
#chartAnnotate +(psCurrent) arrow (" "+formatHMS(eocTime)+" ") (eocTime) (idleCurrent*2) -45 lightyellow 3
I wanted a couple of annotations on the chart and I wanted them placed at specific locations that depends on the curves, this means using tableCalc.../tableTime() to get values from the table. Annotations below curves are placicec at 98% of the value with a top alignment. I format the value in SI format with 3 digits.
The get the values from the table I uses the knowledge I has about how the test was done, especially with the idle current where I take a average from 30 minutes to 10 minutes before the end of the table.
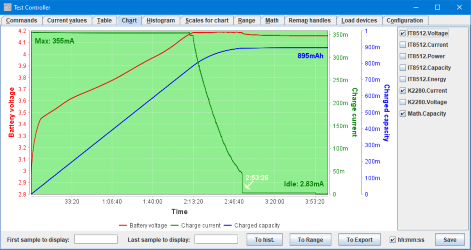
Final formatted chart (It is not from the same battery as the chart at the start).
Notes & download
The script popup windows are present from V1.42 of TestController.
Download script

