Battery test for small batteries, Summary for all tested batteries
This test includes batteries that are around 10440/AAA, 16340/CR123, 18350 and 14500/AA size.
Index
Summary for all tested batteries
Common curves for all tested batteries
Common curves for all tested batteries, the low part
Common curves for all tested batteries, the medium part
Common curves for all tested batteries, the high part
Comparator
Individual tests
How is the test done and how to read the charts
How is a protected LiIon battery constructed
More about button top and flat top batteries
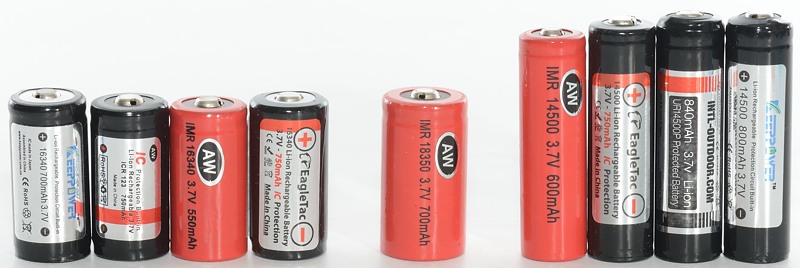
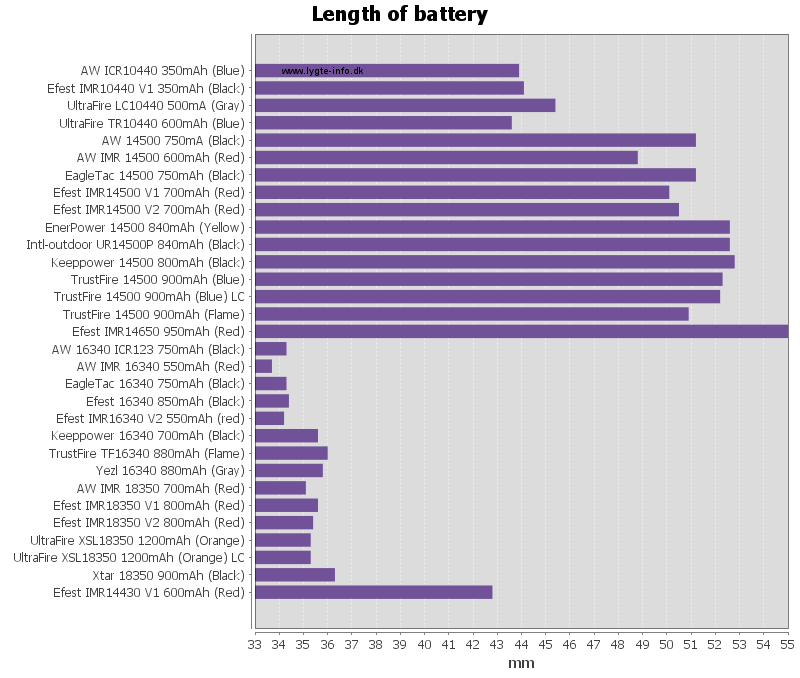
Size of batteries
Before a battery can be used, it must fit in the equipment. This is often a problem with protected batteries, because they are longer than the primary battery. Depending on the size of the battery spring in the equipment it might or might not fit.
A 16340/CR123 battery is supposed to be 34 mm long.
A 14500/AA battery is supposed to be 50 mm long.
The protection is always added at the bottom of the battery here is an example for a 18650 battery.
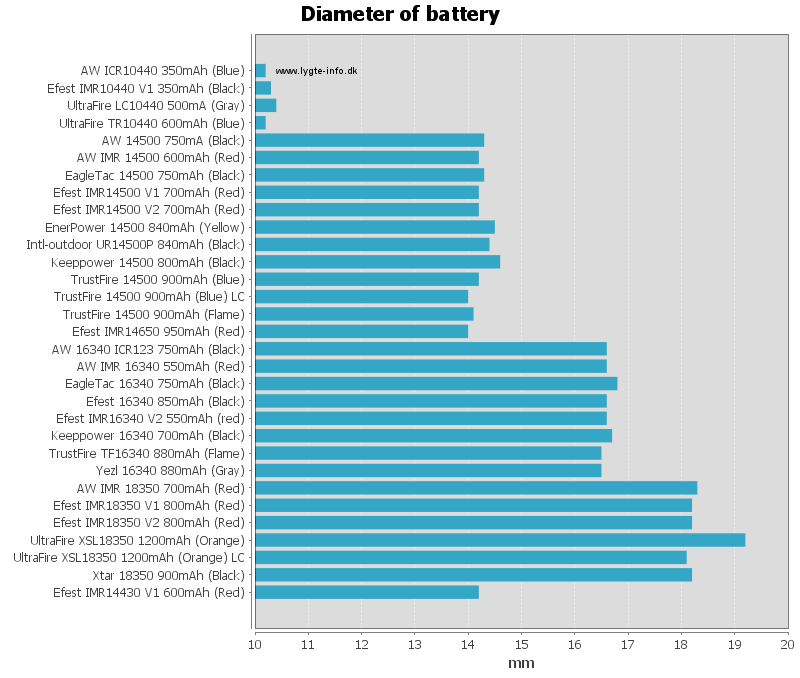
There is a sligt variation of the diameter, this is mostly due to the wire going from the plus pole down to the protection circuit and the extra wrapper layer.
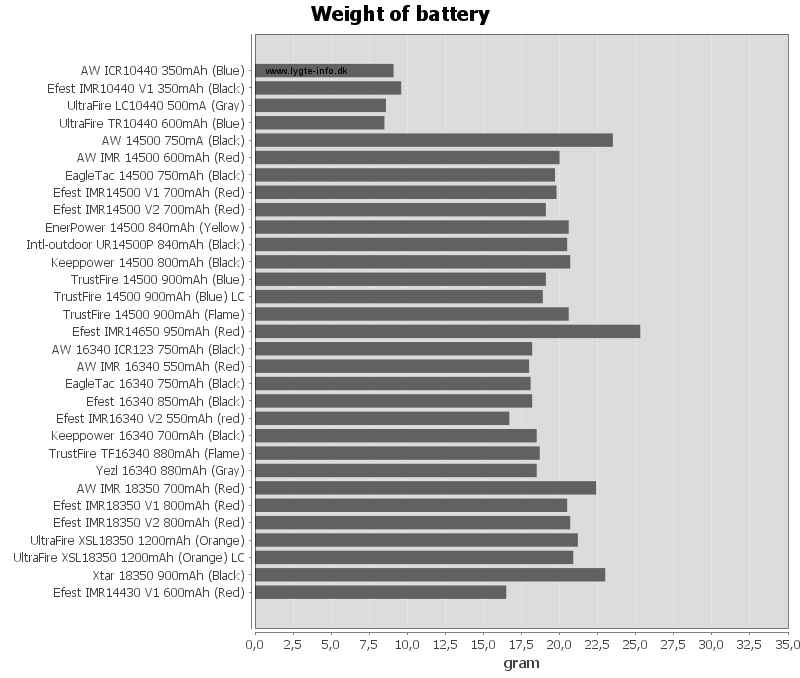
The weight is mostly interesting when there is suspection about the battery being a fake, they will often have another weight.
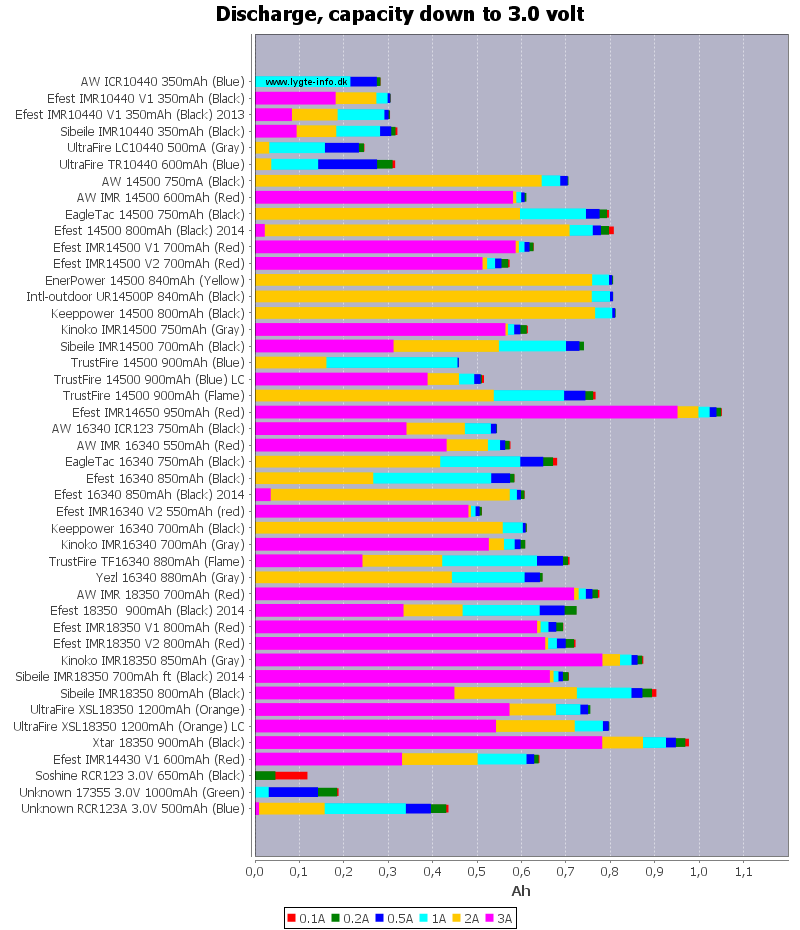
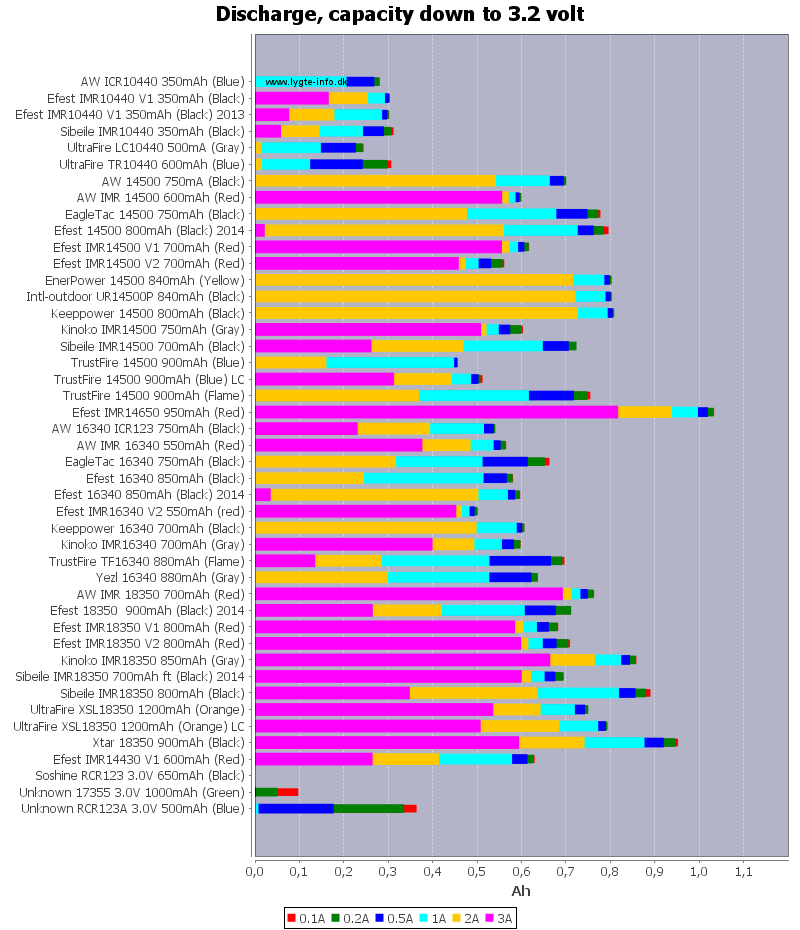
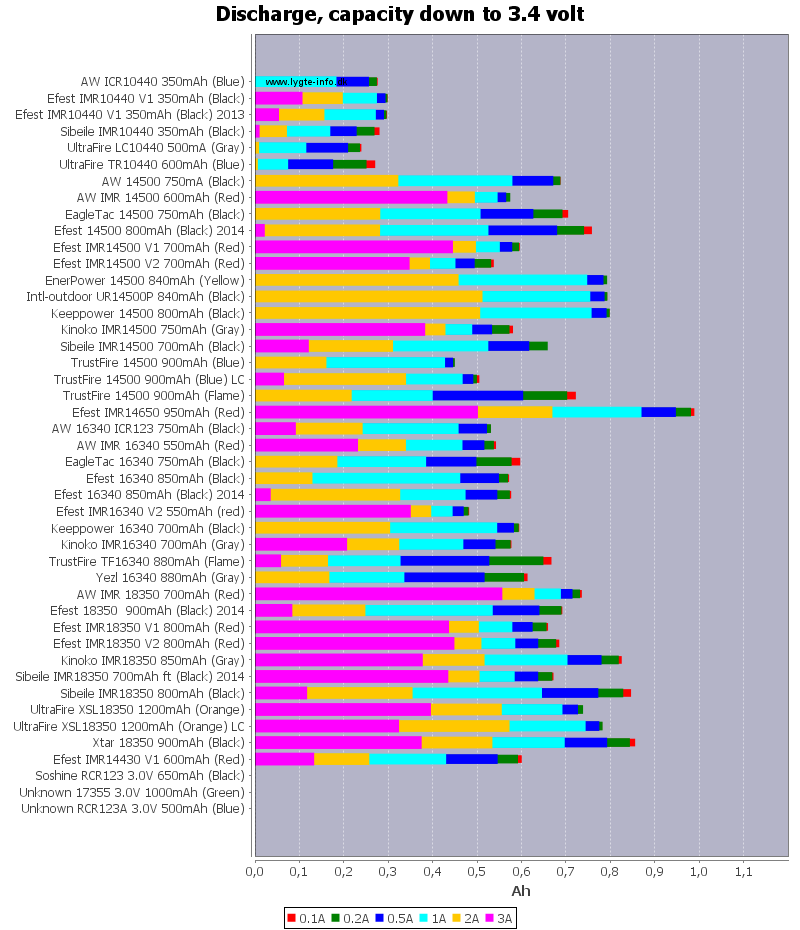
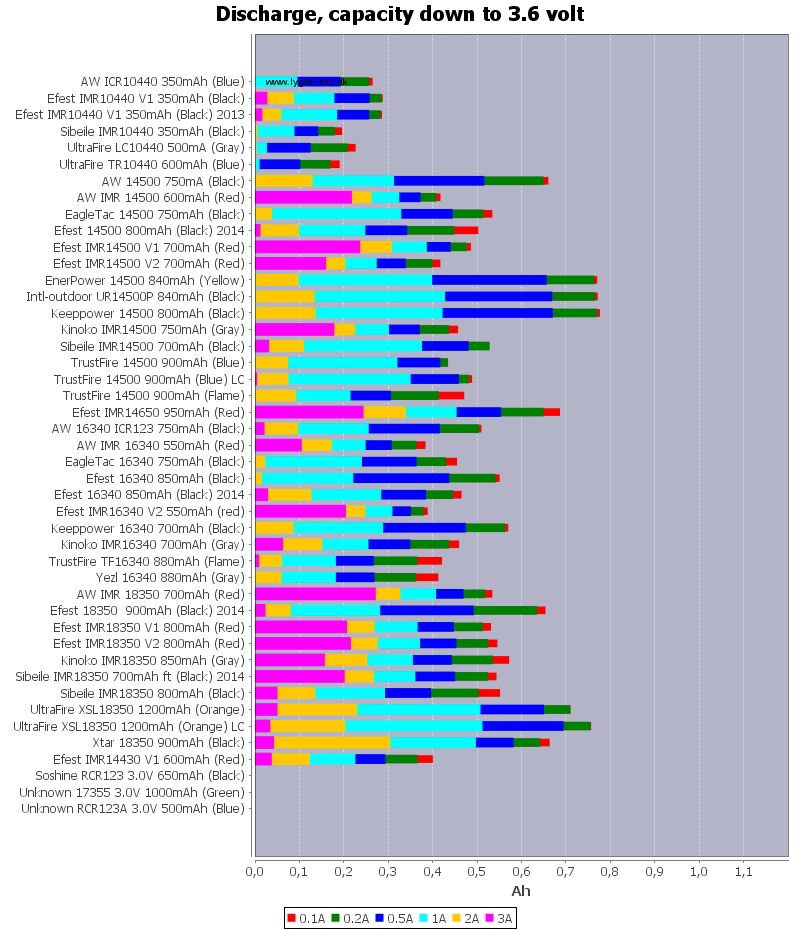
Capacity
Usual batteries are rated with capacity, i.e. how many mAh (or Ah) they have. This value is not a fixed value, but depends on the testing conditions. In these charts I do the test at different currents.
The capacity does also depend on what voltage is required, some equipment works fine at 2.8 volt, but other need more voltage.
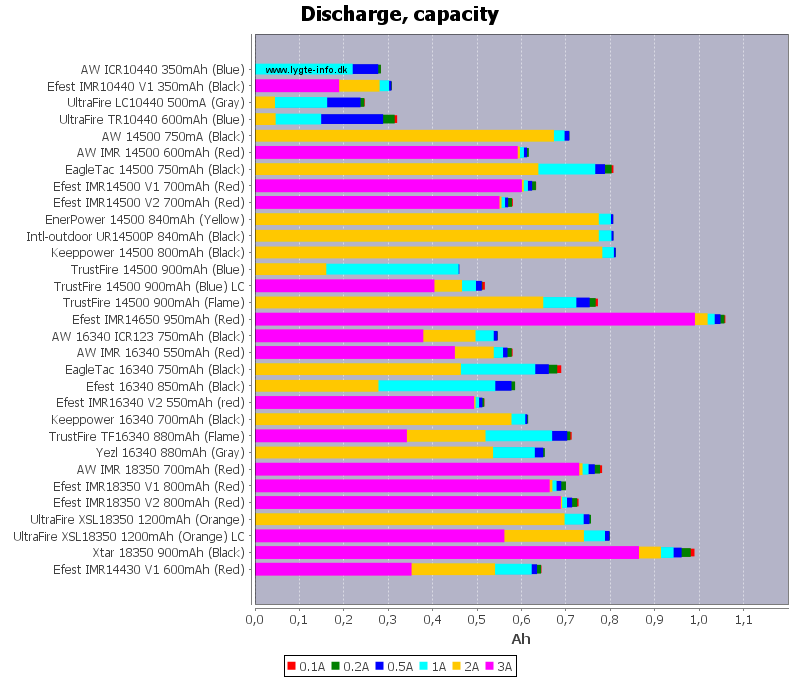
The above chart show the capacity down to 2.8 volt, that is my lower test limit.
Time
This is another way to look at the capacity, how long does it take to empty the battery at different currents.
These charts are with discharge down to 2.8 volt.
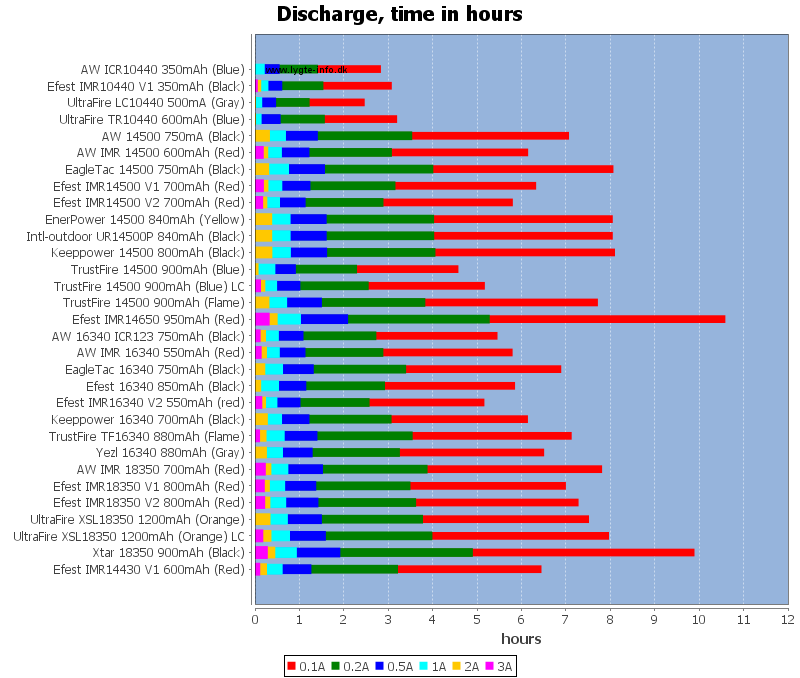
The first chart is in hours, this is fine to see the low currents, for higher currents the next chart is better.
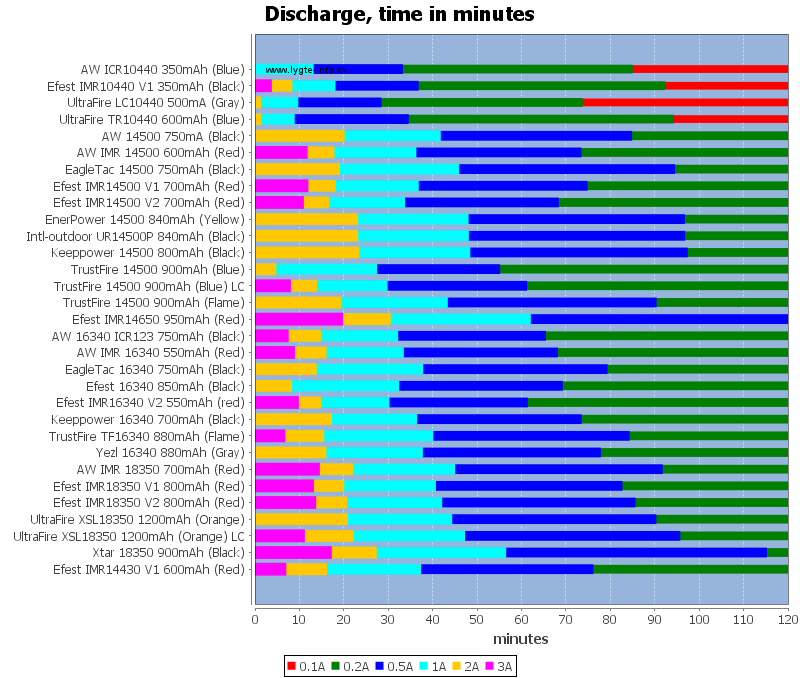
In this chart the lower currents does not fit, but it is possible to see runtime at the higher currents.
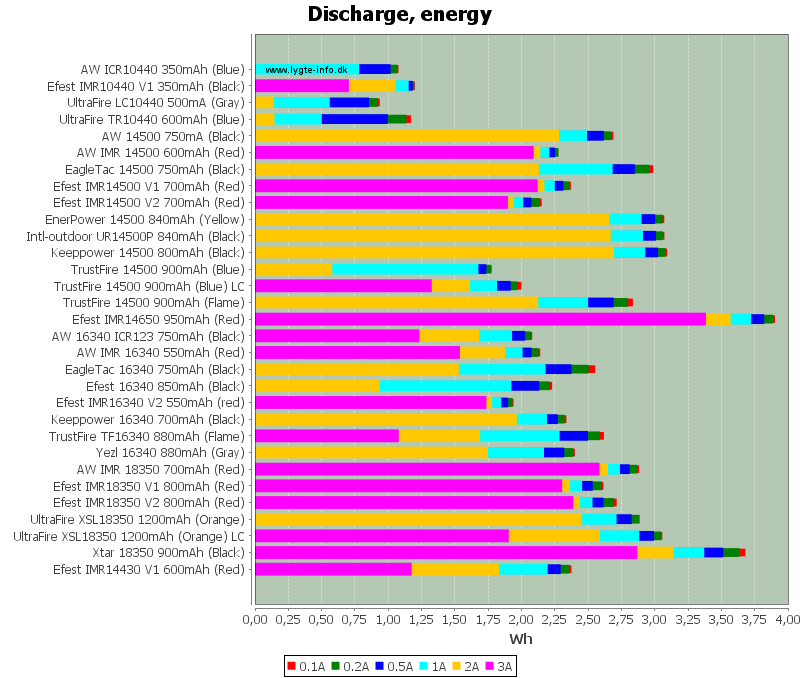
Energy
Energy includes both current and voltage in the same measurement and is a better indication of what the battery can do.
Other measurements
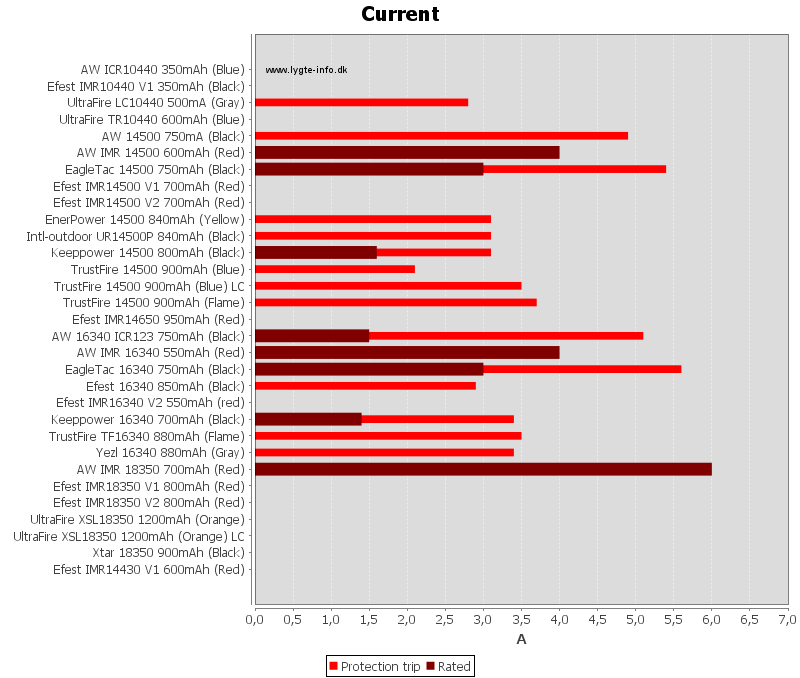
Batteries has recommended maximum current drain on the cell. If this specification is missing, it can usual be assumed to be 2xC, i.e. a 600mAh battery will have a maximum current of 1200mA or 1.2 Ampere. These assumed values are not shown in the chart.
Batteries with a PCB protection also has a trip current, this is at a higher value than the specified current. In my opinion 30% up to 50% above the specified current is best.
The "Protection trip" will be missing for unprotected batteries and because my test equipment is configured to starts at 1 ampere batteries with "Protection trip" below 1 ampere will also be missing.
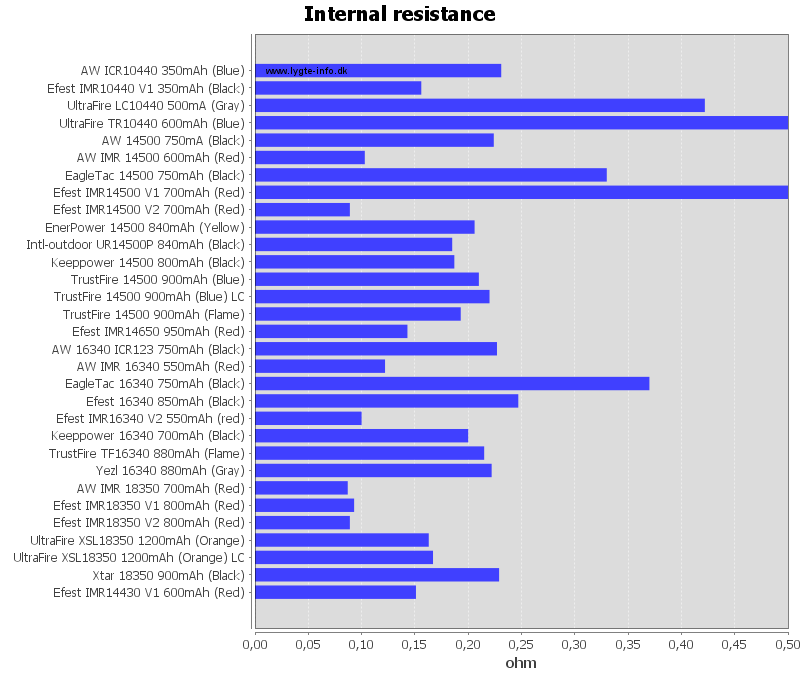
Internal resistance shows how the battery handles a heavy load for short time (The actual test takes up to 1 minute). Batteries with a low resistance will hold the voltage better than batteries with a high resistance.