How do I test a driver
For testing a led driver I vary the input voltage over the specified range while driving a led. I measure current and voltage going into the driver and comming out of the driver and makes charts of them.
Equipment
For testing I uses a lot of equipment, some homemade.
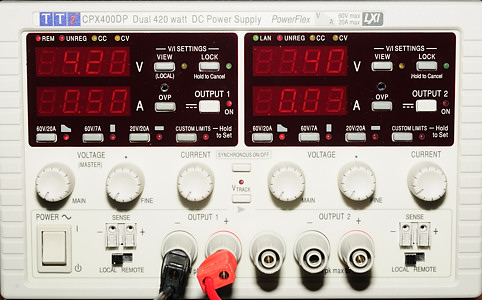
Instead of batteries I uses a variable power supply, this makes it easy to test at any voltage, and because it has computer control I can automatic sweep the voltage over a range.
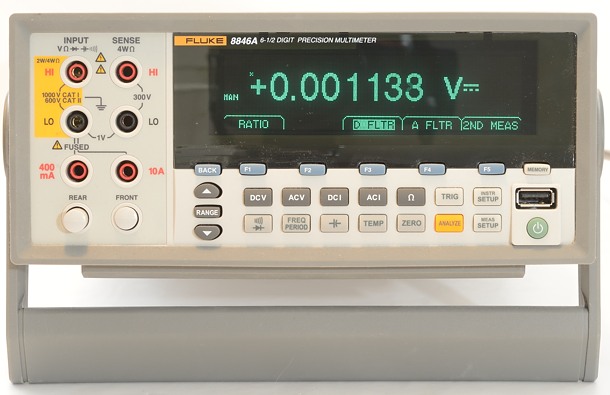
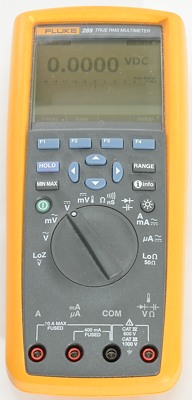
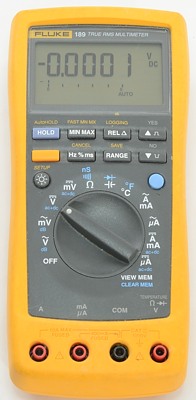
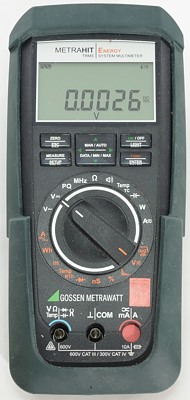
With four values to measure I do need a couple of DMM's, again with computer connection.
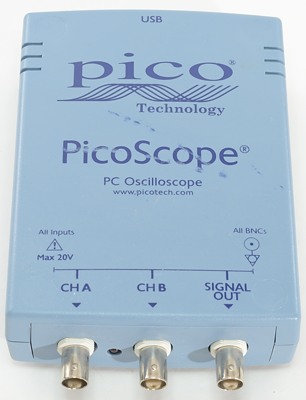
To check pwm I uses a computer based oscilliscope.
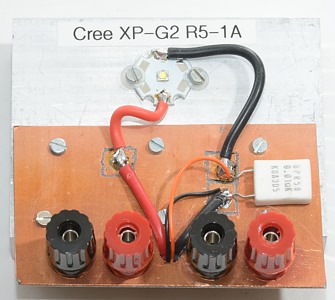
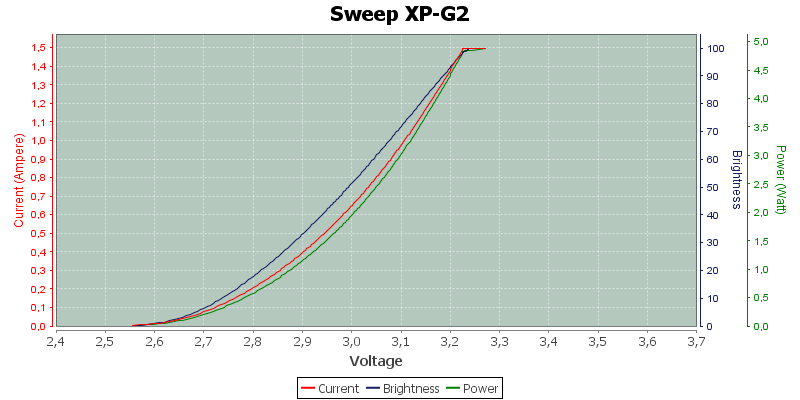
The above rig contains on XP-G2 led and a current sensing resistor. The resistor and wires add 15mOhm resistance.
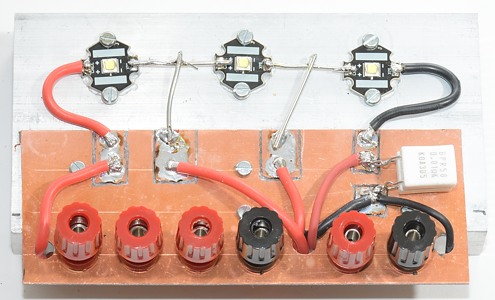
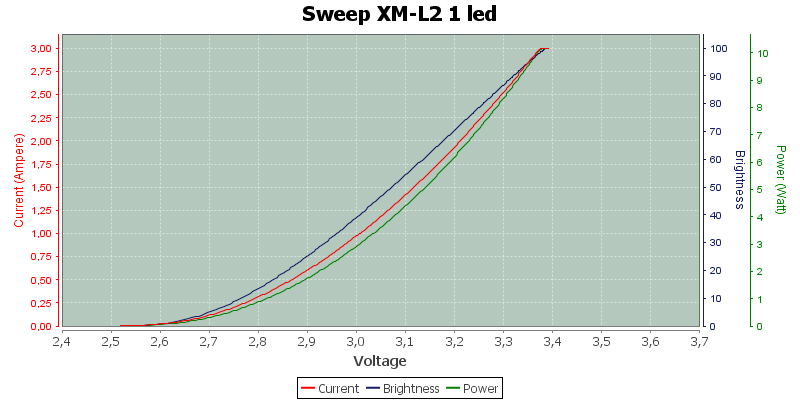
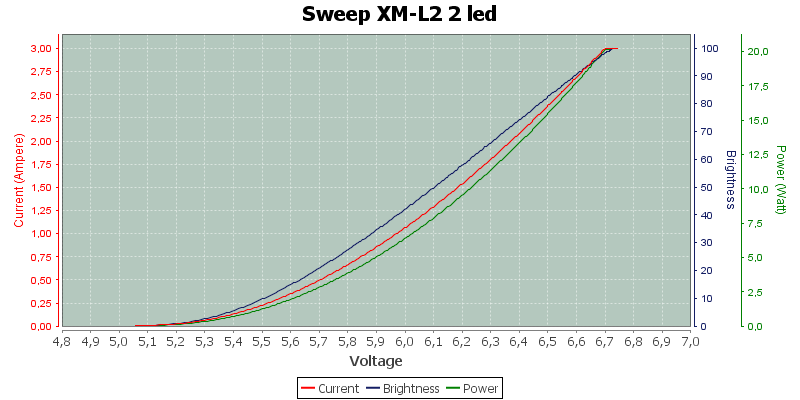
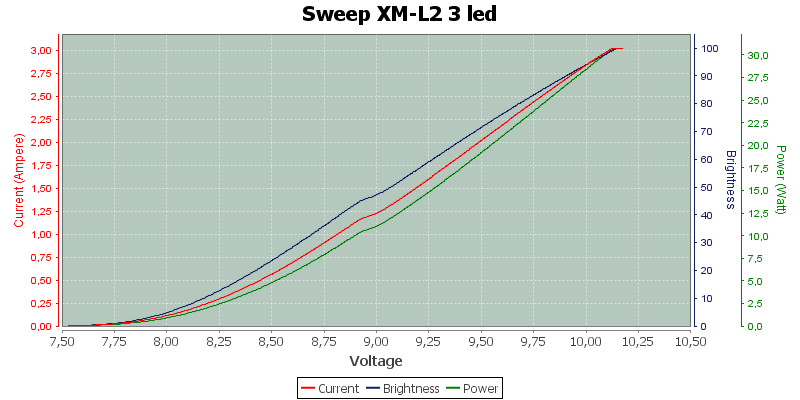
This rig contains 3 XM-L2 leds and can be used with 1, 2 or 3 leds in series. The resistor and wires add 11mOhm resistance.
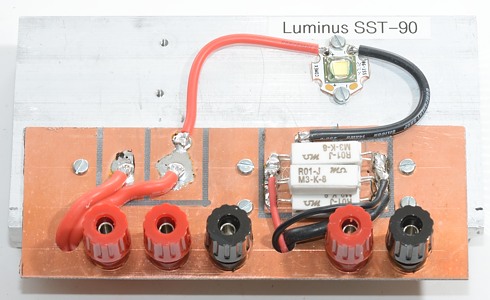
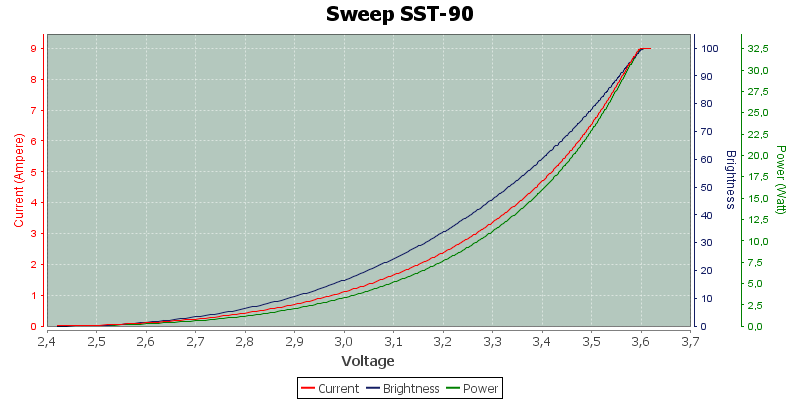
This is a SST-90 rig. The resistor and wires add 7mOhm resistance.
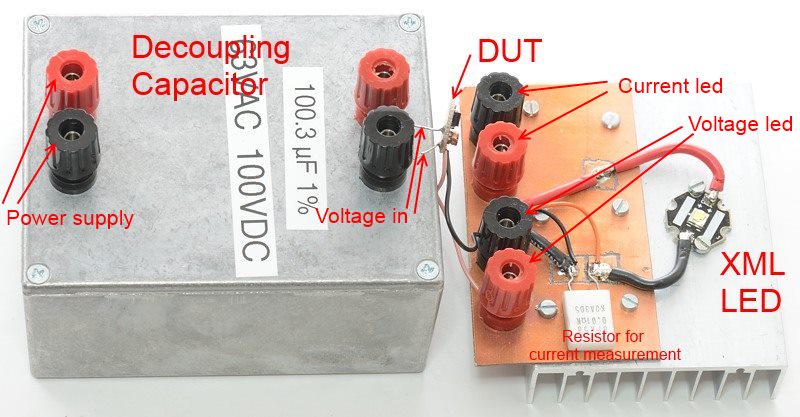
For actual testing I connect the circuit this way. This means that the driver does not have cooling from a flashlight body.
The led voltage is measured before the resistor and wires, this means that it will be slightly to high, depending on current.
With XP-G2 at 1.5A, the voltage will be 0.023 volt to high.
With XM-L2 at 3A, the voltage will be 0.033 volt to high.
With SST-90 at 9A, the voltage will be 0.063 volt to high.
Curves
When making charts they will usual contain a HL or LH in the name:
HL is high to low, i.e. I start at a high voltage and reduces it.
LH is opposite, i.e. starting at low voltage and increasing it. This test is somtimes necessary to find the maximum voltage for the driver.
The difference between HL and LH sweeps is only at the low and high voltage, the middel range will be the same.
When doing these voltage sweeps I will usual step with 0.01 volt between each measurement, but I can use smaller or large steps when necessary. I usual do one step each second
For each measurement I generate 3 curves:
- Current into the driver, i.e. current drawn from battery. Current into the led, with buck and boost drivers this will be different from battery current. Efficiency, how much of the battery power gioes to the led.
- Driver: How much the driver changes the voltage and how many watts is lost in the driver.
- Led: Voltage, current and power to the led.
Because all charts are based on the same four measurements, the information in the charts are basically the same, but from different viewpoints.
With PWM drivers there is a problem calculating power and efficiency, it will be wrong. The problem is that the voltmeter shows the average led voltage, but current only runs when the voltage is above the led forward voltage.
To partially fix this problem, I can predefine the led voltage to a value (Taken from the full power led voltage).
Depending on the actual driver I might also add some scope traces, these can be measured either on the voltage going into the led or from the light out of the led.
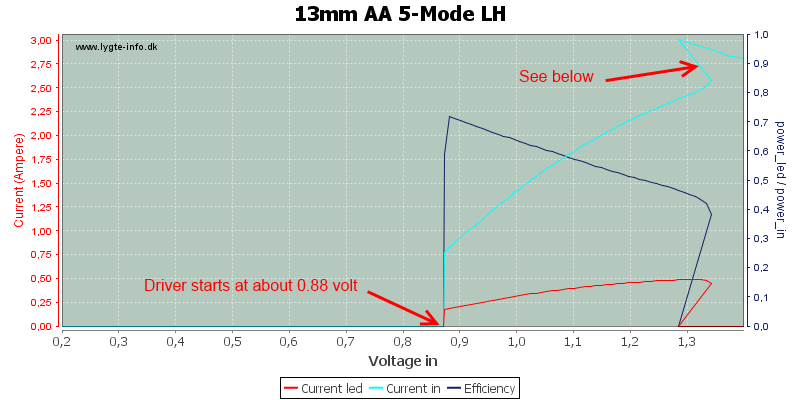
Here is an example, where I start at a low voltage and the increase the voltage.
When there is a step change in the current, the curve will go backwards, this is due to the resistance in the power supply and wires. The usual reasons for a step change is because the driver changes mode or like here, where the driver locks up (The led current drops to zero, but the input current increases).
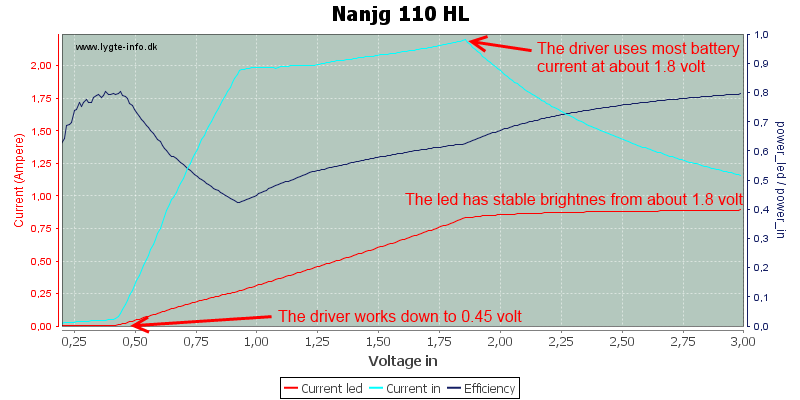
Starting from a high voltage and decrease voltage, makes it possible to see how low voltage the driver will work at.
For this driver anything above 0.9 volt and up to 3 volt is the same as for the LH scan.
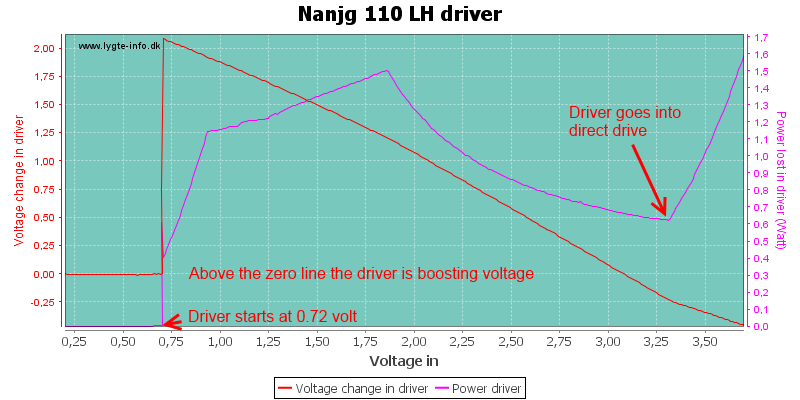
The driver chart shows what is going on in the driver: How much power is lost in the driver and if the driver is increasing (boost) or decreasing (buck) voltage.
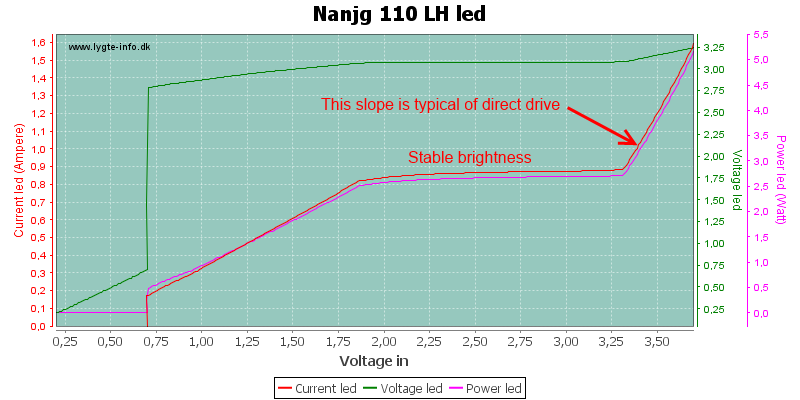
And the led chart show what the led gets.
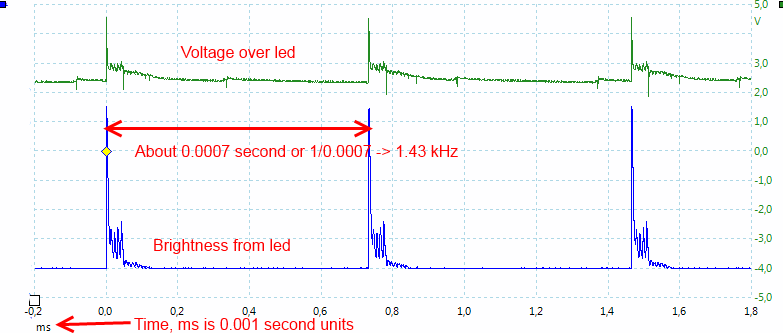
Sometimes I will also add a scope trace, this can be either the voltage over the led or the brightness from the led or both.
In the above scope trace I have included both. The green trace is voltage and the blue is light (Brightness), measured with a photo diode.
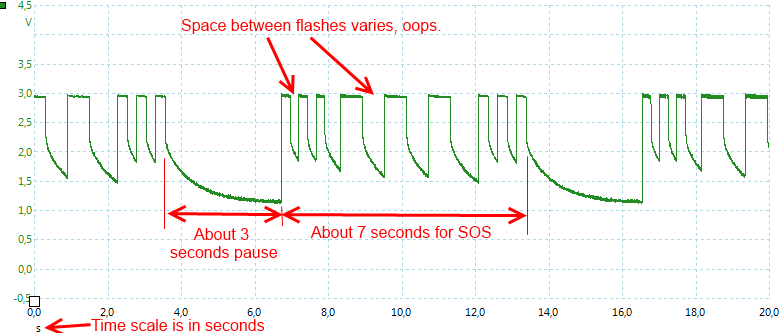
Strobe and SOS is usual shown with a scope trace, where it is possible to get an idea about the timing.
Here I have record the voltage to the led and applied a filter to remove high frequency noise.
Led performance
I did a voltage sweep of the different leds.
