Test controller, chart page
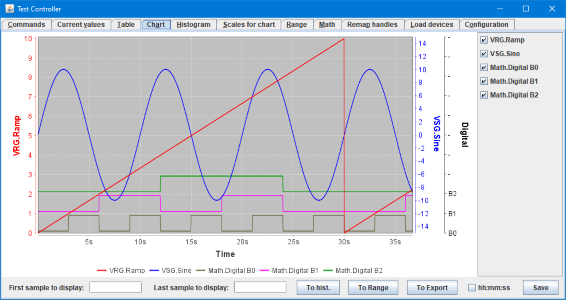
This page shows the logged/table values as a curve. It is possible to select a number of values to show and perform measurements on the curves. As default the data is shown based on time, but any analog value can be used for the Y scale. Scales can be logarithmic.
The chart is using sampled values* this means that it may change on each update when there are more points than the screen resolution can show.
*Sampled values means picking a value from the data at the desired point. The other possibility is using average value that calculates a average for each point, based on the values around it. I prefer sampled values because it is more likely to show fast variations. The sampled data may not show precisely what is going on, but it shows that something is going on (Zoom to get more detailed knowledge).
Contents
What is on the screen
Chart
Range
Copy range
X-Scale
Save chart
Curves
Resolution limit
Scripting
Main page
What is on the screen
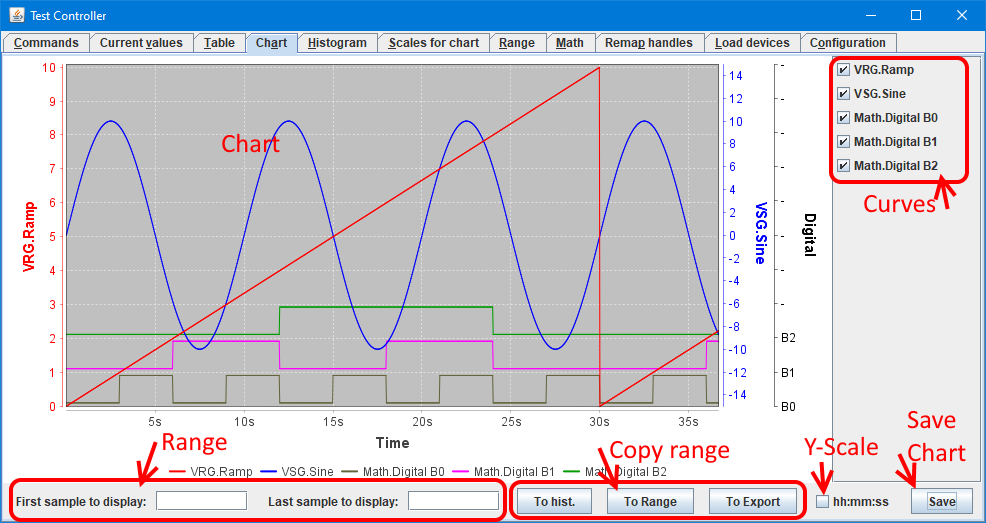
In the above picture I have labelled the different areas of this page, in the following I will go more into details about each area.
Chart
This is the main feature of this page. It will show curves for up to 6 analog values or 5 analog values and a couple of digital values. The first scale will always be on the left side, all other scales on the right side. The sequence of scale will follow the sequence the data to show are selected, except digital that will be shown leftmost when it is on the left side.
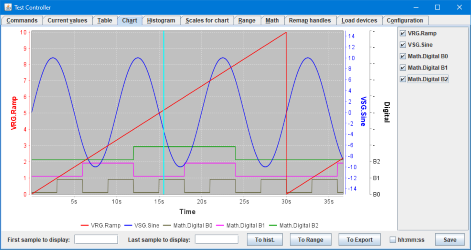
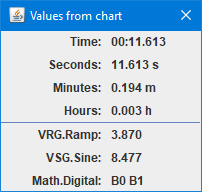
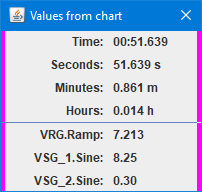
Click on the chart to get a cursor, this includes a small popup window with values for the shown curves at the cursor. Click again to hide the cursor.
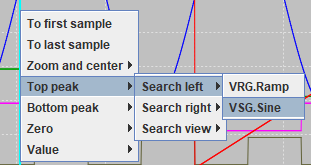
Right click to get a menu. This menu includes zoom functions and search functions.
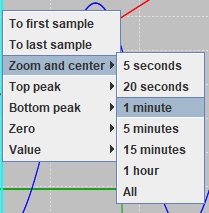
The zoom function can either be fully manual (To first/last sample) or more automatic (Zoom and center).
The search functions can search on any of the visible curves for peak, zero or a specific value. When found the cursor will be locked at that position. The actual search is done on the raw data, this means it may have much higher resolution than shown in the chart. The locked position will be on the nearest screen position. When the cursor is locked it is possible to do a "To first/last sample" or "Zoom and center" operation. A click with the mouse will unlock the cursor.
The Rate function will search for maximum raise or fall rate on selected curve, it uses a 0.1% window (Min 4 samples) for calculating slope. The result will only be meaningful if the data varies fast enough to detect.
The "Zero marker" will change all values in the popup to relative values compared to where the zero marker is.
The search can be done either left or right from the current position or when "view" is select from left to the first match on the screen, peek will find the highest/lowest value on the screen.
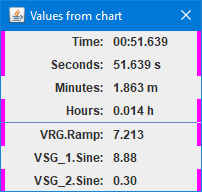
With "Zero marker" placed on the chart the values will be relative, but clicking on values can disable it. The magenta marker shows a value is relative.
Range

Any zoom on the curves are done with these range fields, they list the first and the last sample to show. This can be selected in the chart with the "To first/last sample" or "Zoom and center", but can also be entered manually.
There are a few options when entering values manually:
- h:m:s format
- time in seconds
- time in minutes (use a m postfix)
- time in hours (use a h postfix)
- Sample number (use a # prefix)
- From end of data (Use a - prefix, i.e. enter time or samples as negative value).
- Specify number of samples, instead of last sample (Use a w prefix).
When using the - prefix in the first sample the chart will roll when data is updated, i.e. it is possible to view the last x samples all the time.
Copy range
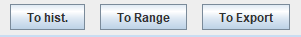
When a interesting part of the curve have been selected with the "first/last sample", the setting can be copied to other pages for more detailed analysis or for exporting the data.
X-Scale

Usually the time is shown as a decimal value, depending on the time span it will be either seconds, minutes or hours. Checking this box here will show time as hours:minutes:seconds instead. Changing this comboxbox will always return to the time x-scale.
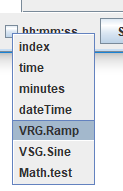
Right clicking on the combobox will show a list of possible x-scales any of them can be selected. Most will use the scale defined in "Scales for chart", but timeDate uses its own format. Selecting any scale but time or timeDate will disable the cursor.
Only the selected range of data will be shown.
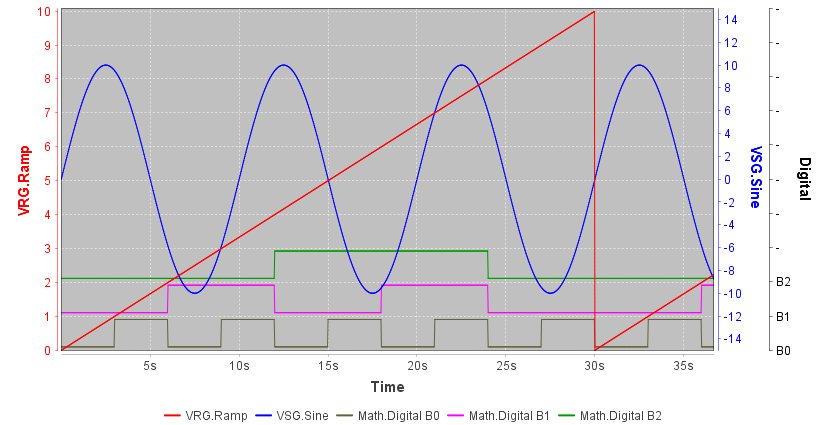
Save chart

It is possible to save the shown chart as a png file. The screen resolution and save resolution is not related.
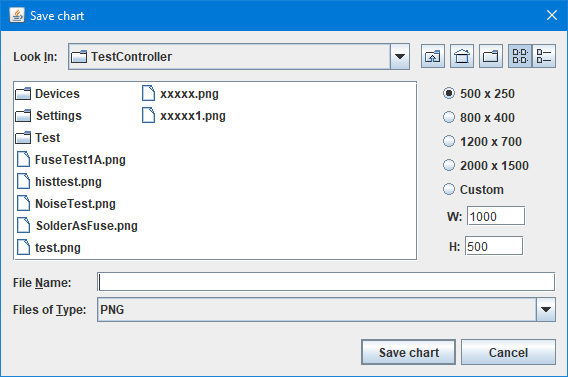
When pressing "Save" a save dialog will be shown where it is possible to select resolution of the saved png file.
The available resolutions are defined on the configuration page.
Curves
Measured values from all devices are listed here and it is possible to select what values to show as curves. Digital channels may have more than one curve, they will all share the same scale.
Resolution limit
The chart will only show one point for each screen point, this may hide spikes. The search function is not affect by this.
The curves will never use more than 5000 points from the raw curve data, this makes it faster to draw a curve.
These limits applies to the shown curve, i.e. even a heavily zoomed curve may contain 5000 point (If there is enough raw data).
Scripting
The chart can be controlled with the following script commands:
#CHARTY axisName
#CHARTSAMPLES first last
#CHARTCURVES curveName {curveName{curveName{..}}}
#SAVECHART filename {width height}
#SCALE name decimals si log auto {includeZero minRange bottomStep}/{min max}/{includeZero minRange bottomStep min max}
#SCALEDELETE name {name {...}}
This is include in the right click menu in the log window: "Generate scripts, Chart/Hist/Range script"
There is another sets of command with functions that is not accessible from the user interface. These are used to customize the chart format, but do not affect the data displayed:
#CHARTTITLE title
#CHARTCOLORS color{ color{ color{...}}}
#CHARTBACKGROUND backgroundColor{ bordercolor{ gridcolor{ fontColor{ titleColor}}}}
#CHARTSCALENAME originalName newName
#CHARTSCALESYNC {reference sync1{ sync2{ ...}}}
#CHARTANNOTATE ...