Test controller, histogram page
This page shows one or more histograms of the logged/table values. It is possible to select number of bins.
Contents
What is on the screen
Histograms
Range
Scale type
Resolution
Save chart
Curves
Cursor and value popup
Scripting
Main page
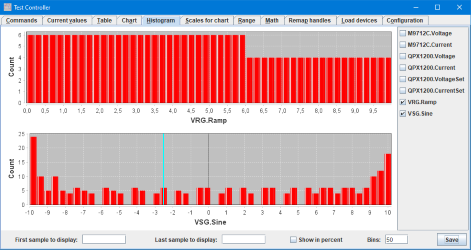
What is on the screen
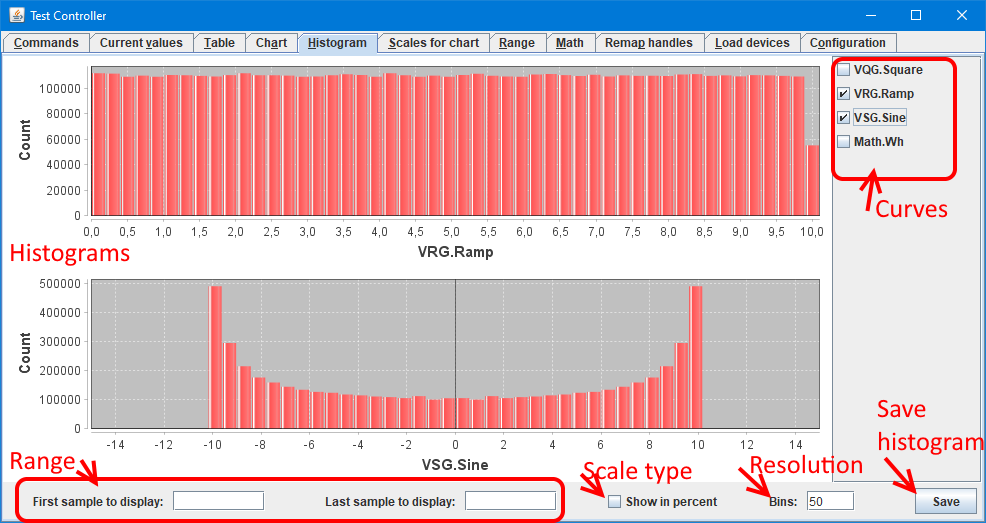
In the above picture I have labelled the different areas of this page, in the following I will go more into details about each area.
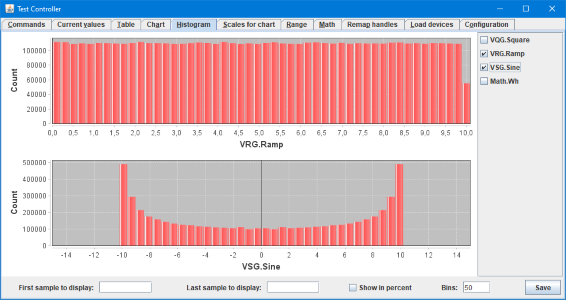
Histograms
The histogram shows the distribution of values, either as a count for each bar or as a percent of total data for each bar. The data used can be the full amount of data or a range of data.
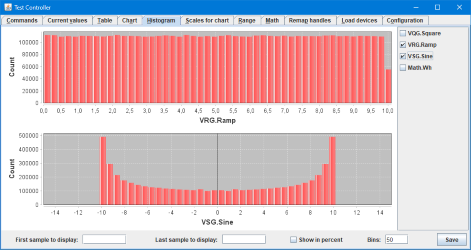
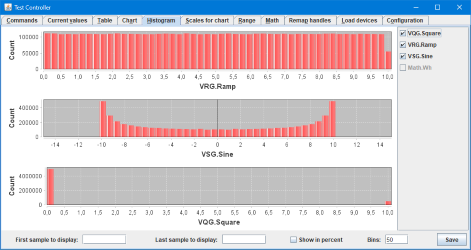
It is possible to show one, two or three histograms at a time.
The scale at the bottom of the histograms is defined on the "Scales for chart" and is the same as is used for a chart.
Range

The range fields are used to limit the data used for the histogram, they list the first and the last sample to include. This can be selected on the chart page and copied to this page, but can also be entered manually.
There are a few options when entering values manually:
- h:m:s format
- time in seconds
- time in minutes (use a m postfix)
- time in hours (use a h postfix)
- Sample number (use a # prefix)
- From end of data (Use a - prefix, i.e. enter time or samples as negative value).
- Specify number of samples, instead of last sample (Use a w prefix).
When using the - prefix in the first sample the histogram will "roll" when data is updated, i.e. it is possible to view the last x samples all the time.
Scale type
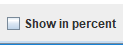
Select between count and percent scale, the actual count and percent will often be smaller when a high amount of bins are used.
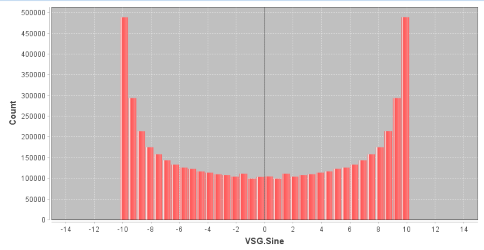
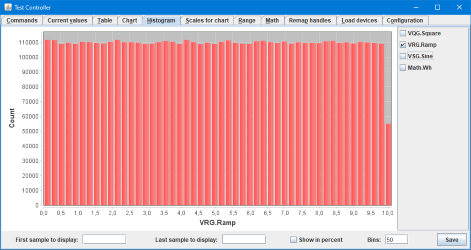
Resolution
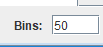
This defines how many bars the bars the histograms is using, it can be from 5 to 1000 bins. It is best to keep the number of bins below the actual resolution.
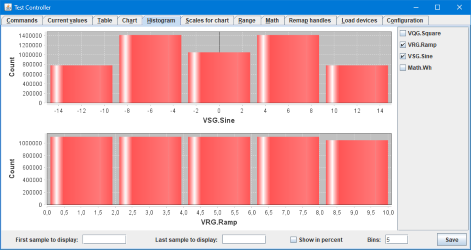
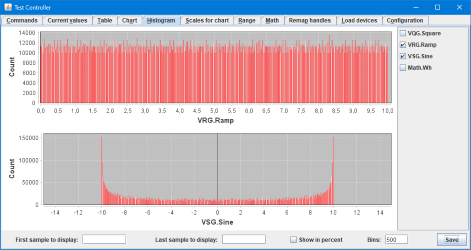
Above is a very low resolution and a high resolution histogram.
When more than 100 bins are used the bars will be plain without any space between.
Save chart
It is possible to save the shown histograms as a png file. All shown histograms is saved as one png file. The screen resolution and save resolution is not related.
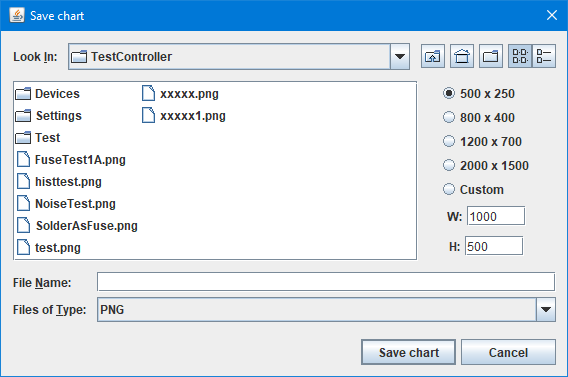
When pressing "Save" a save dialog will be shown where it is possible to select resolution of the saved png file.
The available resolutions are defined on the configuration page.
Curves
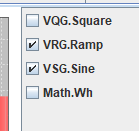
Measured values from all devices are listed here and it is possible to select what values to show as curves. Digital channels will not be included.
Cursor and value popup
Click on one of the histograms to get a cursor, this cursor will only be present in one histogram at a time and will track the cursor.
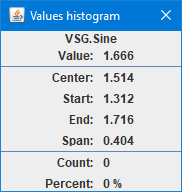
With the cursor is a small popup that shows the values at the cursor, it will always have the same items:
- The name of the value shown
- Value: The actual cursor position.
- Center: The center value for this bar, i.e. (start+end)/2.
- Start: The start value for this bar.
- End: The end value for this bar.
- Span: The width of this bar, i.e. end-start. This will be the same for all bars in a histogram.
- Count: Number of values in this range.
- Percent: Percent of the values in this range (Will use ppm for small values).
Scripting
The histogram can be controlled with the following script commands:
#SAVEHISTOGRAM filename {width height}
#HISTOGRAMOPTIONS {count/percent/%} {bins}
#HISTOGRAMSAMPLES first last
#HISTOGRAMCURVES curveName {curveName{ curveName}}
This is include in the right click menu in the log window: "Generate scripts, Chart/Hist/Range script"
There is another sets of command with functions that is not accessible from the user interface. These are used to customize the chart format, but do not affect the data displayed:
#CHARTTITLE title
#CHARTCOLORS color{ color{ color{...}}}
#CHARTBACKGROUND backgroundColor{ bordercolor{ gridcolor{ fontColor{ titleColor}}}}
#CHARTSCALENAME originalName newName
#HISTOGRAMANNOTATE ...
