Test controller, FFT View popup
This popup can be used to analyse the table data for frequencies, it will use a fast fourier transformation (FFT). This page can only be used when the table contains data.
Because most meters samples at a few Hz, this FFT analyser will mostly be useful for frequencies below 1Hz.
Contents
Generally about FFT
Chart
Control line
Notes
Scripting
Main page
Generally about FFT
Fourier transformation is a way to extract frequency contents from sampled values or with other words change from time view to frequency view. The originally math to do a Fourier transformation was fairly slow, but later on some optimised algorithms was found. They are called Fast Fourier transformation or FFT (The slow version is also called DFT).
Generally there are two issues when using FFT:
- To get a perfect conversion the data must contain a integral number of cycles.
- The FFT function analyses for specific frequencies.
Both of these issues shows up as amplitude variations (That can be fairly large) and a match being more than one frequency wide. To improve the result a windowing functions is usually used, this will not eliminate the issues, but make the result more consistent (What is improved depends on the windowing function).
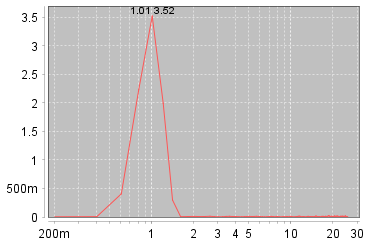
WHen the sample contains exactly one cycle it is possible to calculate the frequency, but for real data it is usually required to have multiple cycles for a good result (due to the above issues).
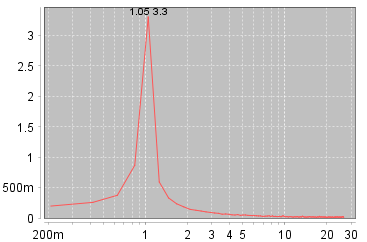
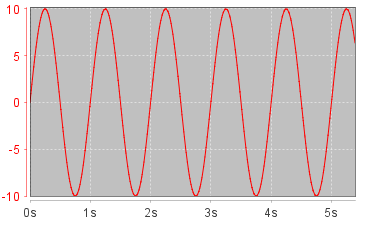
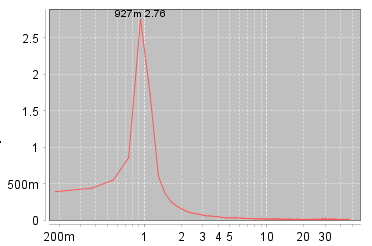
About 5 full cycles, both None and Blackman is fairly good, but Blackman is slightly better on amplitude (Correct amplitude is 3.54).
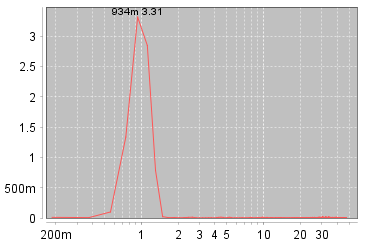
More of a partial cycle, None is low on amplitude and Blackman is stays closer to correct value.
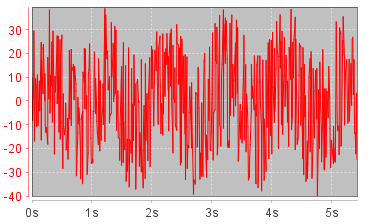
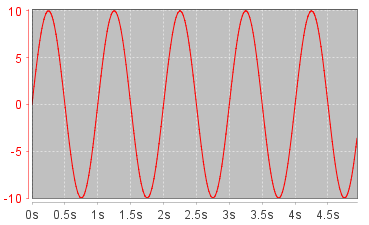
FFT can pull data out of a noise filled signal (This is the same sinus as above, but with noise).
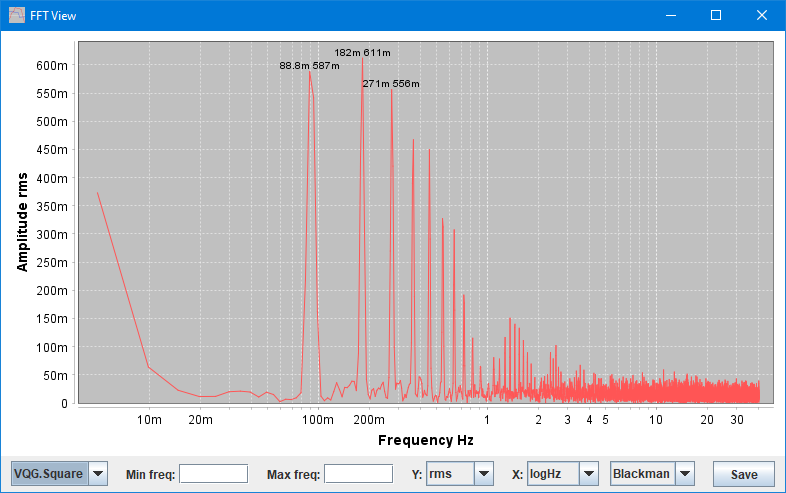
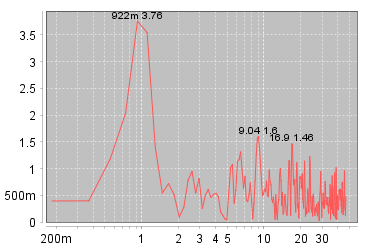
Chart
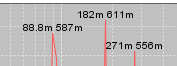
The 3 largest peaks will be marked with frequency and amplitude.
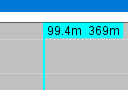
Clicking in the chart will enable the cursor that will show frequency and amplitude for its position. Click again to disable.
The cursor will jump between points and if "Snap to peak" (in popup menu) is checked it will jump between peaks.
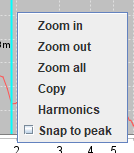
Right clicking will show the menu where it is possible to zoom in/out/all, all the zoom selections will adjust the two "freq" boxes on the control line.
The copy function will copy the chart to the clipboard using the #1 image resolution.
Harmonics will open a text window listing up to 100 frequencies with the largest peak, they will be sorted according to amplitude.
Snap to peak will move the cursor to next peak to the right, this makes it easier to get the exact peak value.
Control line
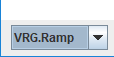
Select the channel to analyse, this can be any data column from the table, but not time or index columns.

When the two fields are empty the analyse will check and display the full possible range for the supplied samples. By using the zoom functions or typing in frequencies in these fields the range can be limited, this makes it easier to separate the different frequencies.
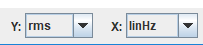
Both amplitude (Y) and frequency (X) scale can select between a couple of possibilities.
For amplitude (Y) it is rms, rms on a logarithmic scale, peak and peak on logarithmic scale, dBV (1V reference) and dBu (0.775V reference, this is also 1mW in 600ohm).
For frequency (X) it is Hz, /minutes, /hours, /day in either linear or logarithmic format. When using linear there is a DC level at 0Hz. The /minutes and /hours scales the reading by 60 or 3600, for /days it is 24*3600.
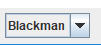
Selects the windowing function to use for improving the result. Blackman and FlatTop will give the most precise amplitude results.
The "none" is sometimes called "boxcar"

Save the current chart to a file, it is possible to select resolution.
Notes
The FFT can handle up to half a million samples on a fast computer (A x86 PC). If there is more samples the data is resampled before the FFT.
Imported date can be analysed, but to get correct frequencies there must be a "time" column with values in seconds (may contain decimals).
Scripting
This popup can be controlled with:
#SHOWPOPUPSYSTEM FFTView {x y {w h}}
#FFTView curveName {minFreq maxFreq {options...}}
#CLOSEALL