Test controller, import popup
This popup is used to import data into a loaded table, it can also be used to load some columns from a csv file.
This function will often change data with interpolation while importing it to match the reference column.
This function can combine unrelated data in useful or confusing ways!
Contents
Control elements
Select file
Reference
Fields/columns
Clear
Import
Using
An example
Scripting
Main page
Control elements
Select file
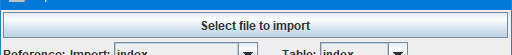
Before doing anything a file to import must be selected, click on the button and select it.
Reference

This controls how to imported, the two selected columns will track in the loaded file. The reference column from the import file is not loaded, but may be used to extend the original reference column, this is required if the reference columns is used a x-axis (As it usually will).
TestController will try to match the reference values in the loaded table with reference values from the import table. If it is impossible to match the columns the import will fail.
The import function has a couple of different strategies to match the reference values. It do not matter if the two datasets uses the same sample rate or only partially overlaps, but there must be some overlap.
For a good import they sample rate must be stable in the two files, variable sample rate will usually mess up the data.
Fields/columns
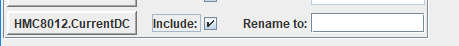
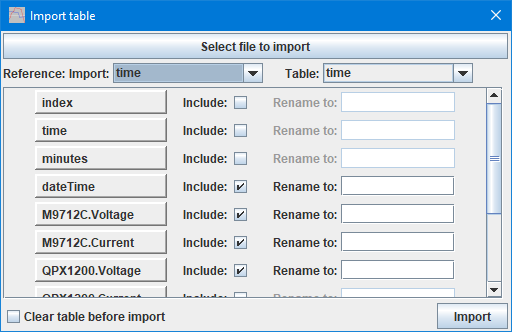
Select what columns to import and optionally enter a new name for them.
Specifying a new name will often disable format and unit tracking, only by using the original name and adding _number (i.e. _1 _23 _678) will TestController be able to locate the format from the imported device.
TestController will perform automatic renaming if required to avoid equal names in the table. This renaming will add a _number to all names and the number will be the same for all names in a import.
Clear

When checked the table will be cleared before importing the data, this makes it a way to load selected columns from a csv file.
Note: index & time will always be included if they are present.
Import

Do the actual importing, if there is an error a message will be shown and the popup will stay open.
When import succeeds the popup will close.
Using
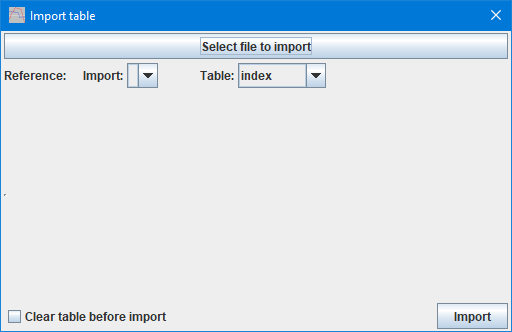
This is the popup when no file is select, but a table exists in TestController.
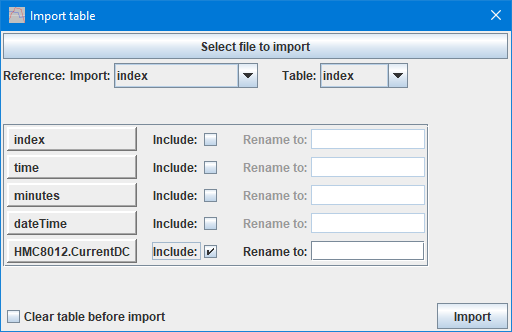
Here a file has been selected and a row is shown for each column in the file.
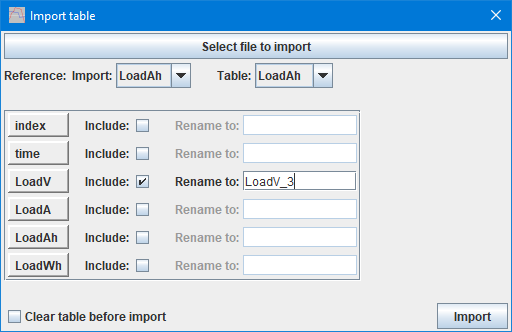
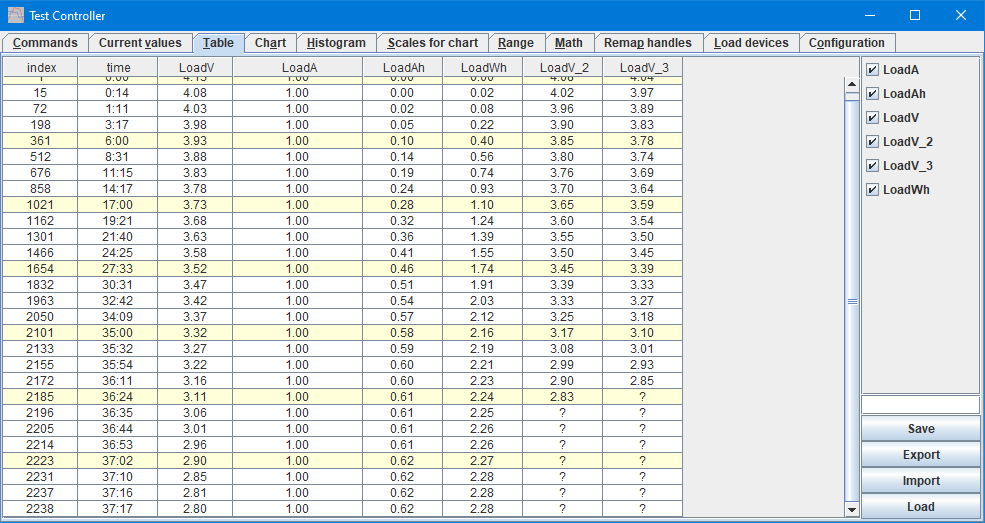
Merging a couple of discharge curves, here I use Ah as the reference and rename the voltage column to show the discharge current.
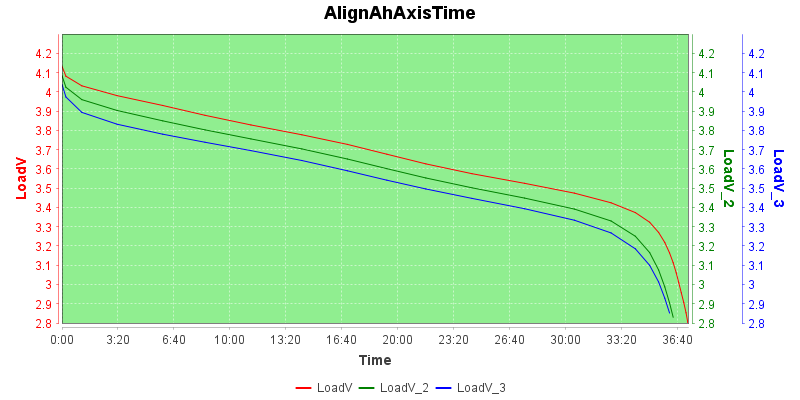
This is a very misleading chart, the different curves do not discharge at the time shown in the x-axis.
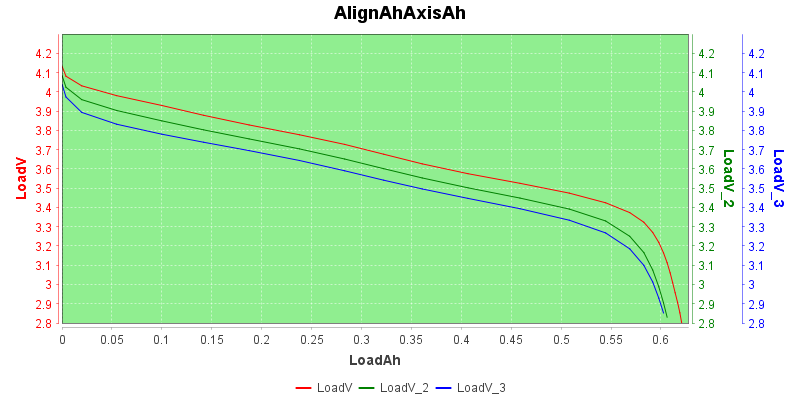
But switching to Ah as x-axis and it is a useful curve. V is 1A discharge V_2 is 2A discharge and V_3 is 3A discharge.
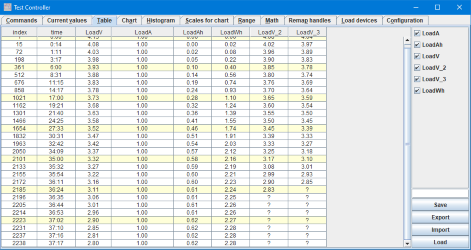
When data is missing there will be a couple of ? in the table.
To handle this the best way on charts set the configuration setting "Overload Chart handling" as "Filter"
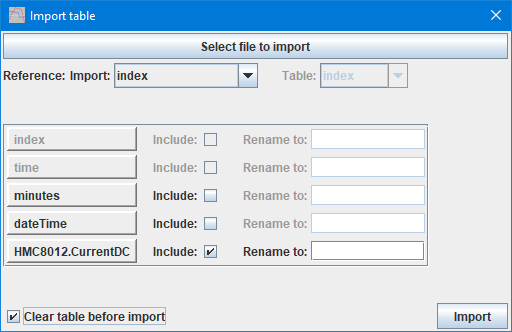
Checking the "Clear table" will switch to the same layout as for an empty table, i.e. no reference column can be selected in the table and index/time will always be included.
An example
One application where import can be used is when logging with two PC's and wanting to correlate the results. Before doing this it is import to synchronize the clocks on the PC's (When they are connection to internet it can be done with a button push). I did a test before synchronizing the PC clock, there the difference was about 40 seconds.

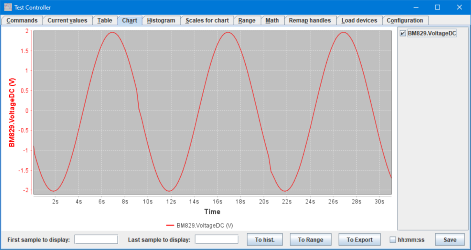
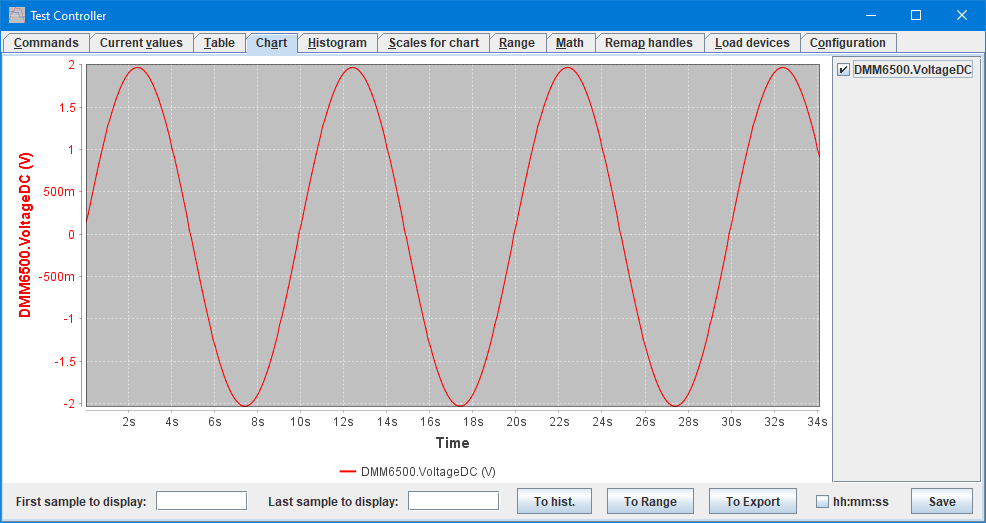
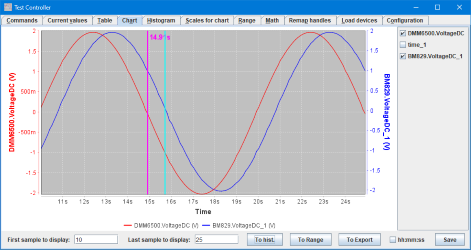
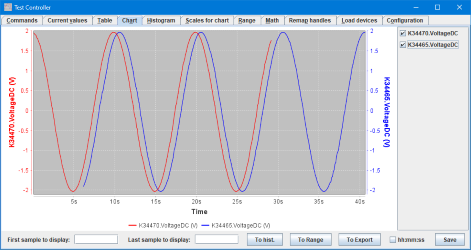
For this example I measured on the same source: A ARB set to a 0.1Hz sinus output and measured it with two different PC's. The data is not synchronized here, the two charts are nearly 180 degree out of phase, but that is probably not the only time difference.
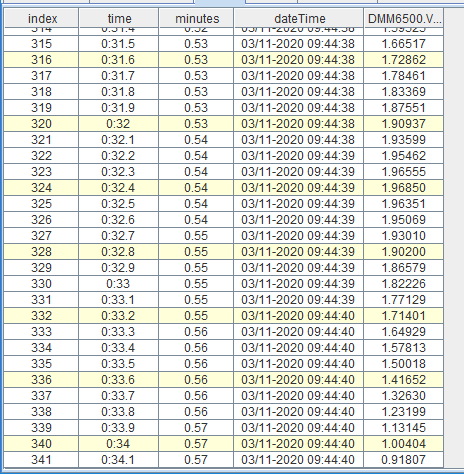
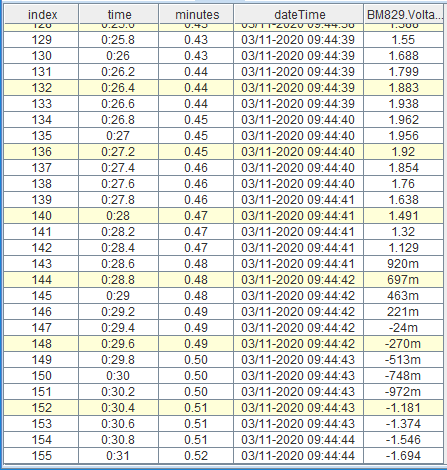
The two tables. The sample rate is different, DMM6500 gets 10 samples a second, BM829 gets 5 samles a second. The BM829 curve ends four seconds after the DMM6500 curve (Look in the dateTime column).
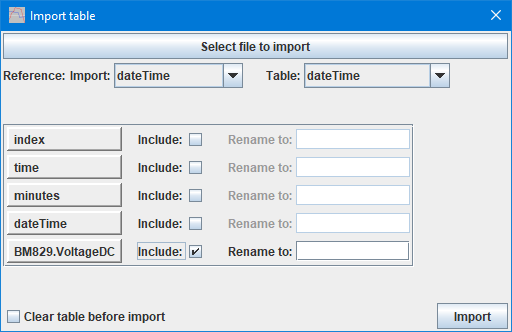
Then I imported the BM829 data into the DMM6500 data while using dateTime as reference (I did also include time, but that is not needed).

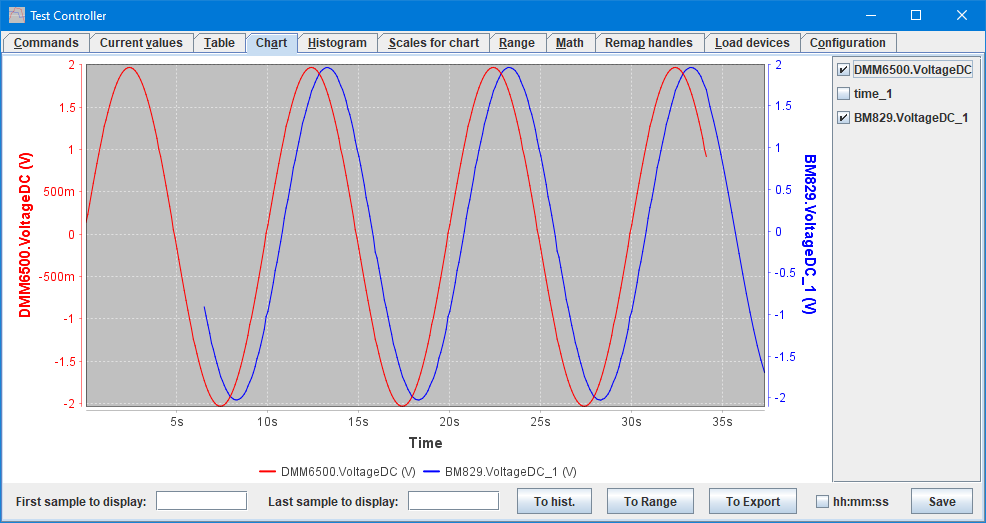
The chart for the combined data. The BM829 was started about 6.5 seconds later than the DMM6500.
Because I included time and it matches a already existing column, both imported columns gets a _1 at the end, I could have avoided that if I manually had renamed the time column.
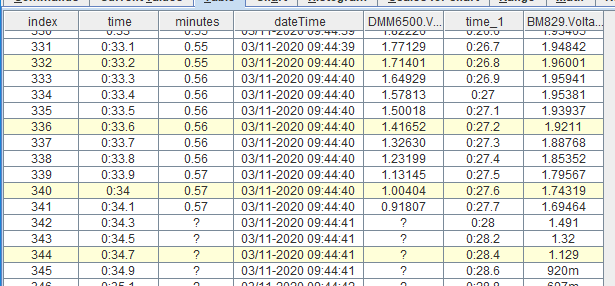
And the table. The data from the BM829 do not match the original table in values, because they are interpolated to match the sample point in the already loaded file. This means doubling up the points for the BM829 to match the 10 samples/sec and then interpolating the BM829 voltages to these points.
The difference between the two data sets is less than 1 second, some of it due to the meters and some of it may be because the clocks where not synchronized perfectly.
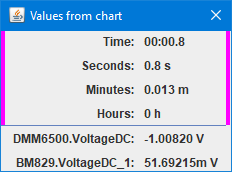
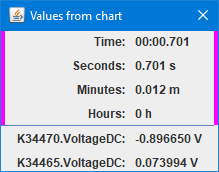
The measurement with the relative cursor (The voltages are absolute).
Same test, here done with more similar meters and fairly fast sample rate on the meters (1PLC).
But the synchronization was not significantly better, this probably means the PC are not synchronized much better than 0.7 second.
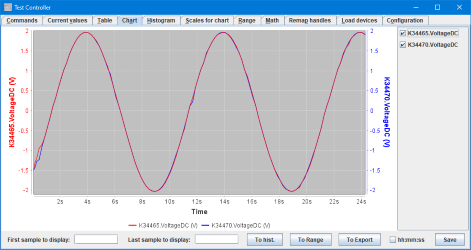
Same meters on a single PC, this time the curves match perfectly.
Scripting
The import can be directly performed with:
#IMPORTTABLE filename referenceColumn columns...