Test controller, range page
This page shows statistic for the measured values or a range of the measured values. This is the same type of statistic as "Current values" pages.
Contents
What is on the screen
Range statistic
Range
Slope unit
Samples in range
Scripting
Main page
What is on the screen
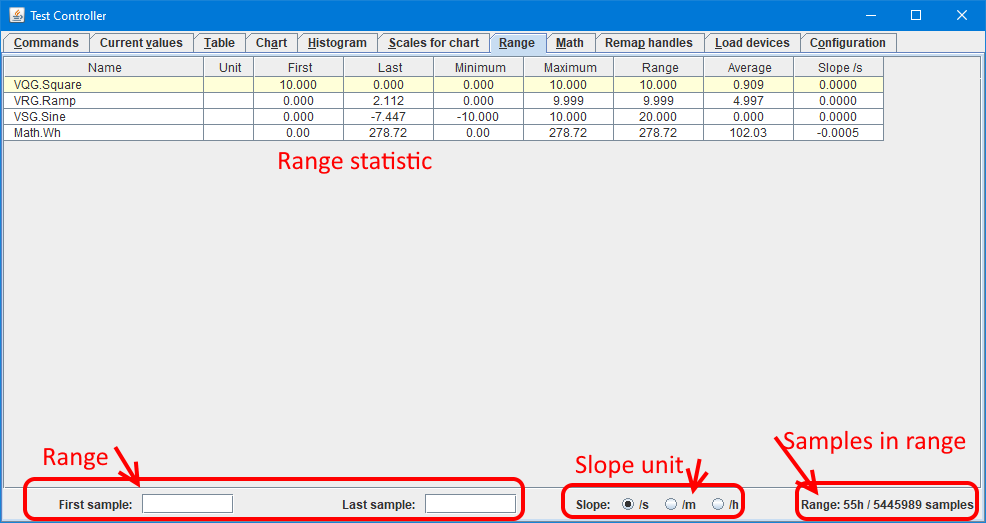
In the above picture I have labelled the different areas of this page, in the following I will go more into details about each area.
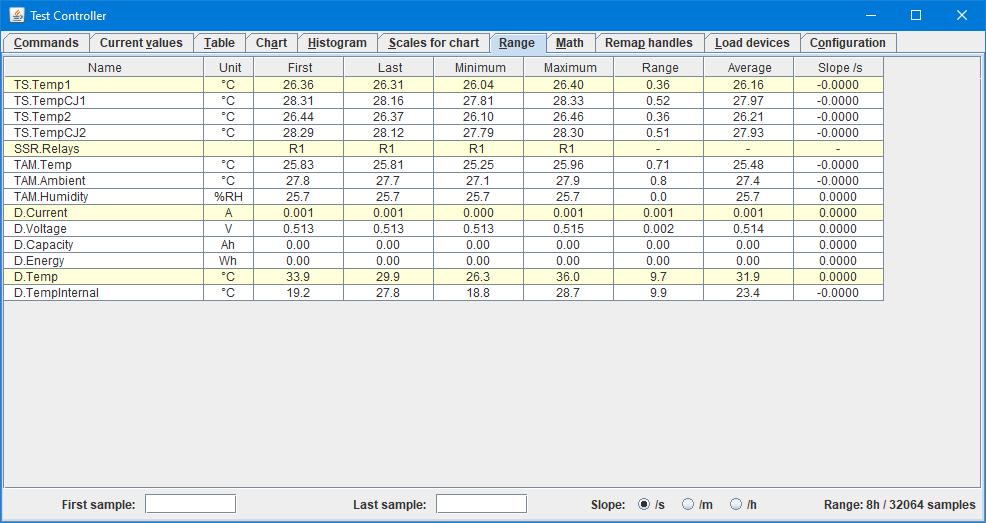
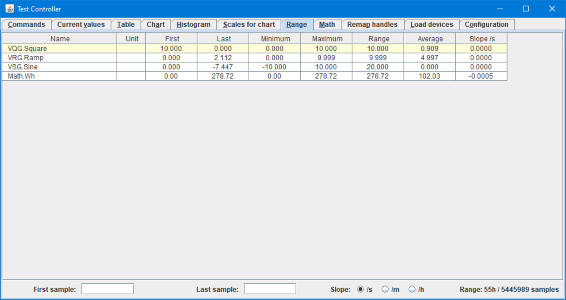
Range statistic
There is shown statistic for each measured value. Digital channels will only show minimum and maximum, calculated by AND and OR operations.
- Name: The name of this value, this is the same name as used everywhere else.
- Unit: If a unit is defined for this value it will be shown here.
- First: The value at the start of the range that statistic is calculated for.
- Last: The value at the end of the range that statistic is calculated for.
- Minimum: The minimum value found in the values, digital used AND.
- Maximum: The maximum value found in the values, digital used OR.
- Range: The difference between maximum and minimum.
- Average: The average of the samples.
- Slope: A estimated slope from first to last sample. The unit can be either /seconds, /minute or /hour.
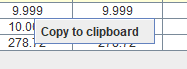
Right click on the statistic and it is possible to copy it as text. The format is with tabs and can be pasted into a spreadsheet or a text document. The decimal point used will match the system settings.
Range

The range fields are used to limit the data used for the statistic, they list the first and the last sample to include. This can be selected on the chart page and copied to this page, but can also be entered manually.
There are a few options when entering values manually:
- h:m:s format
- time in seconds
- time in minutes (use a m postfix)
- time in hours (use a h postfix)
- Sample number (use a # prefix)
- From end of data (Use a - prefix, i.e. enter time or samples as negative value).
- Specify number of samples, instead of last sample (Use a w prefix).
When using the - prefix in the first sample the statistic will "roll" when data is updated, i.e. it is possible to view the last x samples all the time.
Slope unit
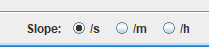
Scale slope values for either seconds, minutes or hours.
Samples in range
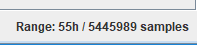
These numbers shows how many samples the statistic covers, both in time and actual samples.
Scripting
The range can be controlled with the following script commands:
#RANGESAMPLES first last
#RANGEOPTIONS {/h/m/s}
#SCALE name decimals si log auto {includeZero minRange bottomStep}/{min max}/{includeZero minRange bottomStep min max}
#SCALEDELETE name {name {...}}
This is include in the right click menu in the log window: "Generate scripts, Chart/Hist/Range script"