Test controller, scales for charts page
This page shows the scales used for charts and histograms. It is possible to set manual scales and define how auto scaling works or each scale.
Contents
What is on the screen
Scales
Input format
Change many scales simultaneous
Remove scales
Scripting
Main page
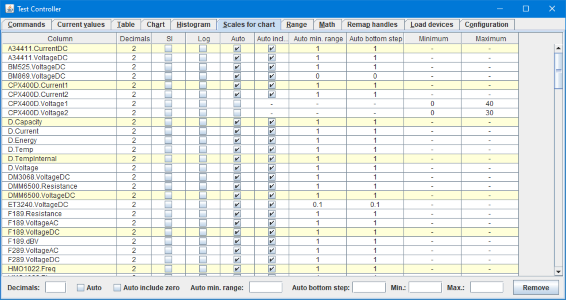
What is on the screen
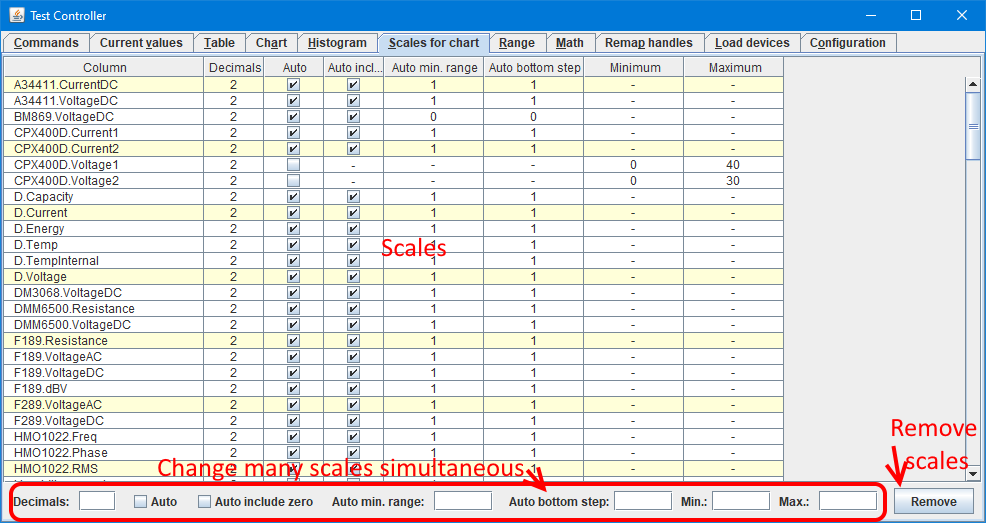
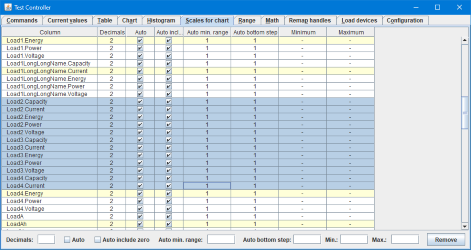
In the above picture I have labelled the different areas of this page, in the following I will go more into details about each area.
Scales
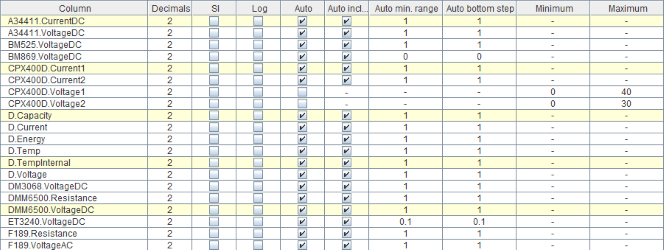
Scales on the chart and histogram will be listed here. Each new scale used will be added to the list. Unused scales will not be removed automatic.
- Column: The name of the value that uses this scale.
- Decimals: Number of decimals used on the scale (Not all formats uses this setting), this will not affect the table or range pages.
- SI: Show numbers with a SI prefix (pnumkM), this is most useful when values are far away from 1.
- Log: Use logarithmic scaling for this scale (Only on chart, not on histogram). Zero and negative values are handled according to configuration.
- Auto: Use auto scaling.
- Auto includes zero: When using auto scaling zero must be included in the range.
- Auto min. range: Minimum range that can be used for auto scaling, set this high enough to avoid to noise. Minimum value is 0.
- Auto bottom step: The steps used for the bottom of the scale, if it is 10 the bottom of the scale can start at "... -10 0 10 20 30 ..." etc. Minimum value is 0.
- Minimum: Bottom of scale when using manual scaling.
- Maximum: Top of scale when using manual scaling.
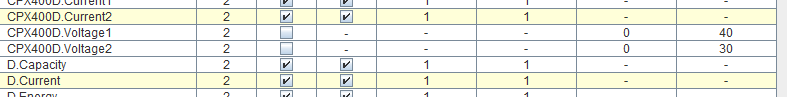
Values in unused columns are shown with a "-" sign and can not be edited.
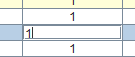
Click on a field to type a new value, the editor can also be enabled by pressing F2.

The scales used at the current time are marked with green behind the column name.
Input format
The minimum/maximum fields can be change to center/span format:
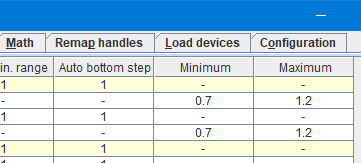
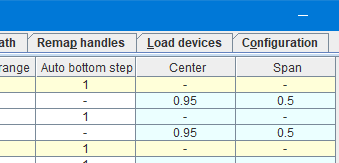
Click on the heading to change between the two formats.
Change many scales simultaneous

These fields are duplicates of the columns, changing a checkmark or typing a value and pressing ENTER will change that value for all selected rows.
Remove scales

Because scales are only added and never removed automatic, it may sometimes be a good idea to remove some scales, any needed scale will be automatic recreated with default values.
It is possible to select many scales at a time for removal.
Scripting
The scales can be controlled with the following script commands:
#SCALE name decimals si log auto {includeZero minRange bottomStep}/{min max}/{includeZero minRange bottomStep min max}
#SCALEDELETE name {name {...}}
This is include in the right click menu in the log window: "Generate scripts, Layout"
This is include in the right click menu in the log window: "Generate scripts, Chart/Hist/Range script"