Estimating remaning capacity in LiIon batteries
There exist a few tables showing how much capacity a specific battery voltage is equal to on LiIon battery, but I wanted to do my own for a couple of different batteries and see what I get.
For this I am not using the same parameters as in the battery test, here charge termination current is 50mA and I discharge down to 2.5 volt. I have done this to get maximal capacity from the battery.
To do these curves and tables I need to discharge a little bit, stop and measure the voltage, and repeat until the battery is empty.
AW 18650 2600 mAh with 1A load
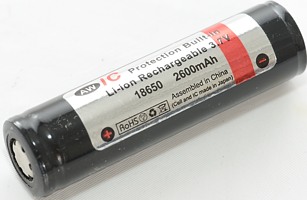
My review of the tested battery
%20-%201A-Capacity.png)
I stops for each 100mAh and records the voltage. The voltage with the load disconnected is just a spike (because no current is discharged during the time).
%20-%201A-Hours.png)
Showing the discharge with a timescale makes the it easier to see the voltage with load disconnected.
These spikes does also show how much the battery voltage will drop when loaded with 1A, i.e. if you measure a battery to 4 volt and the put it into a light with 1A current draw it will drop 0.1 volt to 3.9 volt and this will happen in a very short time.
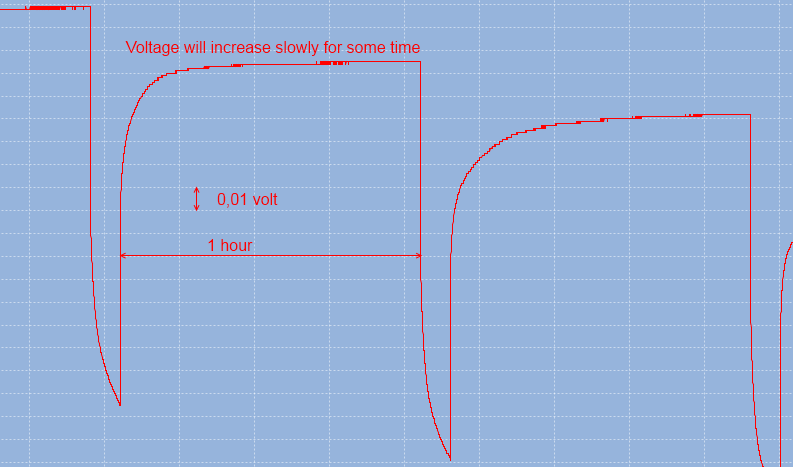
A closer look at the increased voltage during the pauses, shows that it will slowly increase, especially during the first few minutes.
%20-%201A-percent.png)
Plotting the voltage and the charge percent, makes it much easier to see. The difference between measuring immediately after turning the light off and 1 hour later can be up to 10%.
It can also be seen that a loaded voltage of 2.5 volt will immediately jump up to 3.3 volt when the load is removed and slowly reach 3.4 volt after 1 hour.
AW 18650 2600 mAh with 3A load
The same setup as above, but this time with a 3A load.
%20-%203A-Capacity.png)
The difference between loaded and unload voltage is greater.
%20-%203A-Hours.png)
The raise when the load is removed takes longer time.
%20-%203A-percent.png)
The loaded voltage is considerable lower and the he voltage after 1 hour is slightly lower than for a 1A load.
This also shows very clearly why you cannot take the battery out to measure the volt driving the led. When the load is removed the voltage increase about 0.25 volt in less than 10 second (Looking at my raw data I can see that most of that increase is within the first second).
Sanyo UR18650FM 2600mAh
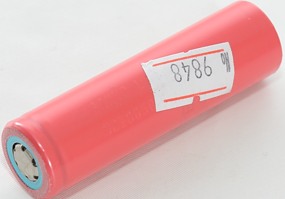
My review of the tested battery
%20-%201A-percent.png)
%20-%203A-percent.png)
Panasonic CGR18650CH 2250mAh
I uses a battery from EnerPower, but the non-loaded voltage is valid for all CGR18650CH batteries.
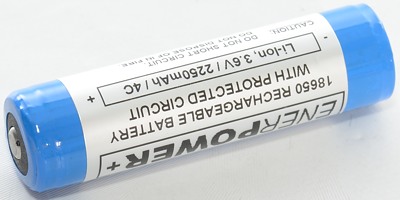
My review of the tested battery
%20-%201A-percent.png)
%20-%203A-percent.png)
This battery is rated down to 2.5 volt and as can be seen, also has capacity at a lower unloaded voltage, but not as low as the NCR18650 battery.
Panasonic NCR18650A 3100mAh
I uses a battery from intl-outdoor, but the non-loaded voltage is valid for all NCR18650A batteries.
My review of the tested battery
%20-%201A-percent.png)
%20-%203A-percent.png)
This battery is rated down to 2.5 volt and as can be seen, also has capacity at a lower unloaded voltage.
Panasonic NCR18650B 3400mAh
I uses a battery from Keeppower, but the non-loaded voltage is valid for all NCR18650B batteries.
My review of the tested battery
%20-%201A-percent.png)
%20-%203A-percent.png)
This battery is rated down to 2.5 volt and as can be seen, also has capacity at a lower unloaded voltage.
Tables
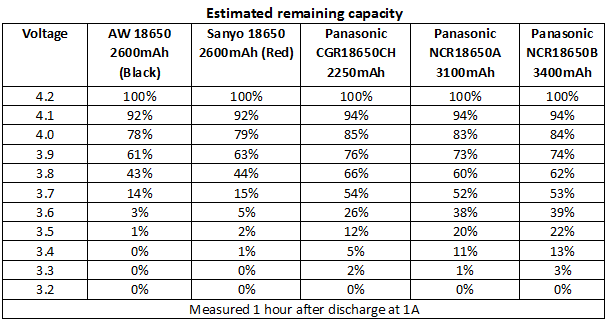
I have collected the 1A values in this table:
And the 3A values in this table:
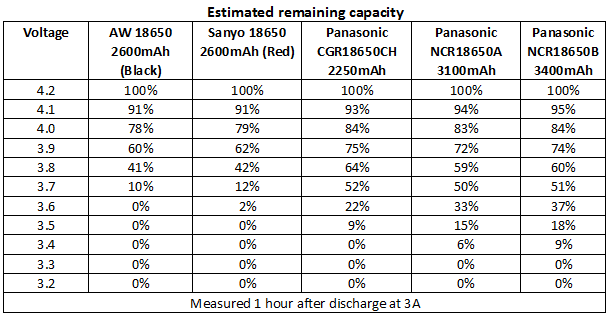
In the 3A tables the capacity is exhaust at a higher voltage, this is because the cell needs more voltage to produce 3A than it needs for 1A load.
In the above curves, notice the difference in volts between the 10s and 1 hour trace, this is always below 0.1 volt, i.e. if measuring 10 seconds after load is removed, the error is not more than one 0.1 volt step wrong.
Waiting two minutes makes the voltage close to the one hour value, especially at 3A load this wait will improve the precision.
Conclusion
When using voltage to estimate remaining capacity, it is necessary to use different tables for different chemistries and it is also necessary to wait a few minutes after load is removed to get a good estimate.
In the table below I have combines the minimum values from the two above tables and also combined the two NCR18650 cells, because they are very close in voltages.
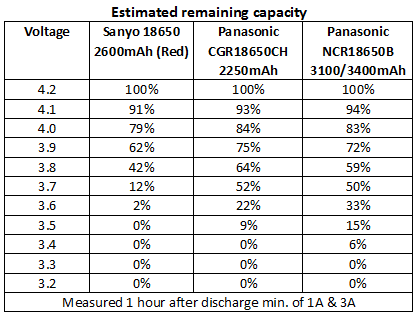
If measuring before 1 hour, the capacity will be higher than this table shows, but never more than next line. I.e. a Sanyo that shows 3.8 volt just after the load is removed, will have more than 45% and less than 62% remaning capacity. Looking at the curve it can be seen that the correct value is 52% for a 1A load.
There curves and tables are only a guide, there will be difference between the same battery, depending on age and temperature.
Notes
To do these measurements I used one of my battery test stations, but with another program.
Photo of equipment used for battery test station