How do I test a charger
When testing chargers I want to measure and record both current and voltage simultaneous for the full charge and know exactly when the charger says the battery is full. I have done this small write-up to show how I solved the above measurement task.
Recording
The measurement of voltage and current can be done with two DMM and to record the data I uses a computer connection from each meter. This was supposed to be easy enough, but the Fluke computer program could only handle one meter at a time, i.e. I had to do my own recording program.
The computer interfaces for the meters uses an encapsulated IR link, i.e. the DMM has absolutely no electrical connection to the computer or to the other DMM. The encapsulation secures that I can use multiple meters close together without interference.
Measuring current
I have shown how to do this before:
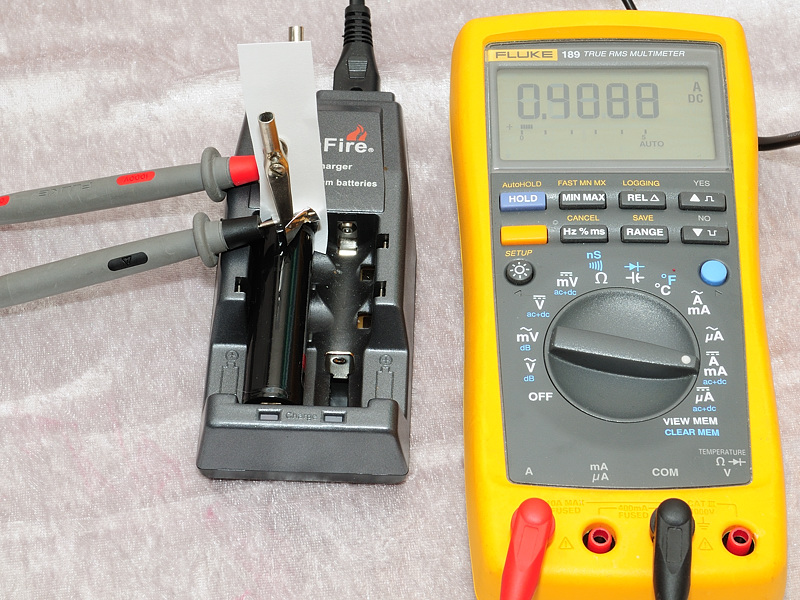
But this is a simple way to do it, and not the most precise way. A check shows that with my Fluke 289, probes and tinfoil I has a voltage drop of 160 mV when the current is 1 A, i.e. 160 mohm resistance. This is much too high for me. I could have used shorter probe leds and multiple layers of tinfoil to reduce the resistance, but I selected another solution.
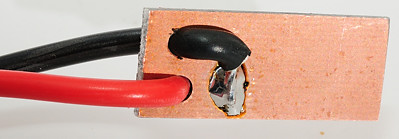
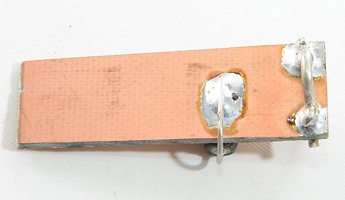
A piece of double sided PCB with the wires soldered to it. This is 1.6 mm thick and can be used in most chargers, if I uses short batteries, maybe even unprotected batteries. Used together with my Fluke 289 I get the voltage drop reduced to 39 mV at 1 A, i.e. 39 mohm resistance and this will be the same each time I use it. This is good, but I can make it even better.
This adapter is used when I measure small currents, it will work down to uA.
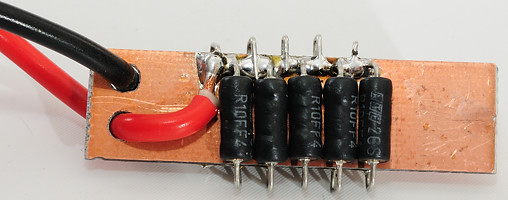
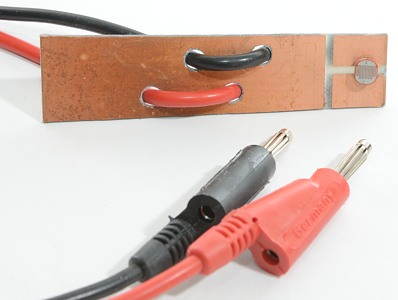
Placing the series resistance on the PCB, removes any resistance from wires. With 10 resistors of 0.1 ohm 1% I have 10 mohm (Measurements says 10.6, the copper adds some). The meter will not affect the resistance or voltage drop. A difference of less than 11 mV at 1 ampere is small enough to be ignored.
There is one disadvantage with this small resistance, it is difficult to read small currents. I have to accept a tolerance of about ±1 mA. At 1 ampere the measurement with this adapter and measured directly with a DMM matches within 3% (Assuming 10 mV/A).
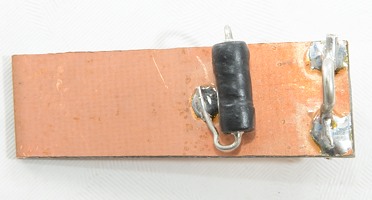
I have also made a adapter with 0.1 ohm resistor, this is used together with my oscilliscope, because the signal from the 0.01 ohm is too small.
The above adapters do not work when testing AA/AAA chargers, there is simply not space for them.
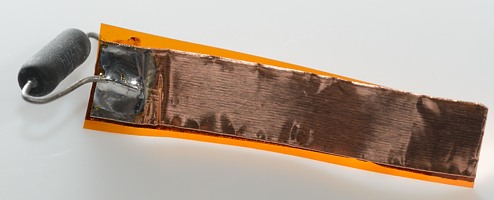
The solution was kapton foil with copper tape on. These sensors are not as robust as the above solution and I need to remake them after a couple of chargers. The photos show newly made adapters, first time I use them, I will trim the size to fit.
Measuring voltage
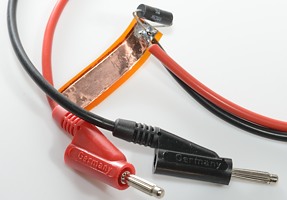
This is no problem, a piece of tinfoil (or copper foil) at the other end of the battery and the voltmeter connected between the current adapter from above and the tinfoil. I connected the meter to the charger side of the current adapter, i.e. the meter will show the output voltage of the charger, not the battery voltage, but the difference will be very small.
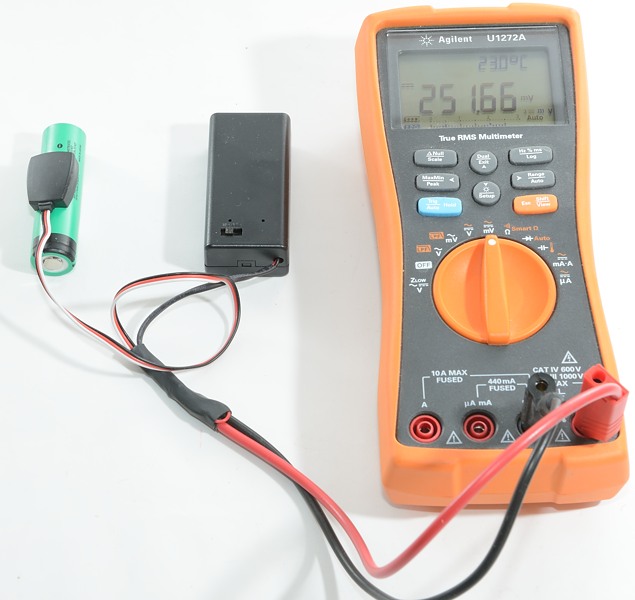
Measuring with full or empty battery
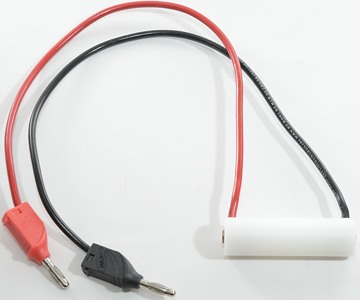
I have to do a couple of measurements with a empty or even overdischarged battery and also with a full battery. To do this fast I got somebody to make the above battery adapter for me. It is the same size as the battery and allows me to use a bench power supply to simulate the battery. This way I can simulate any battery voltage I wish.
When does the charger say "battery full"
Charging a battery takes hours and I did not want to sit looking for when the lamp on the charger changed from red to green to say "battery full". With some chargers it is easy enough to see on the recorded data, because they turn the current off, but not all chargers does this!
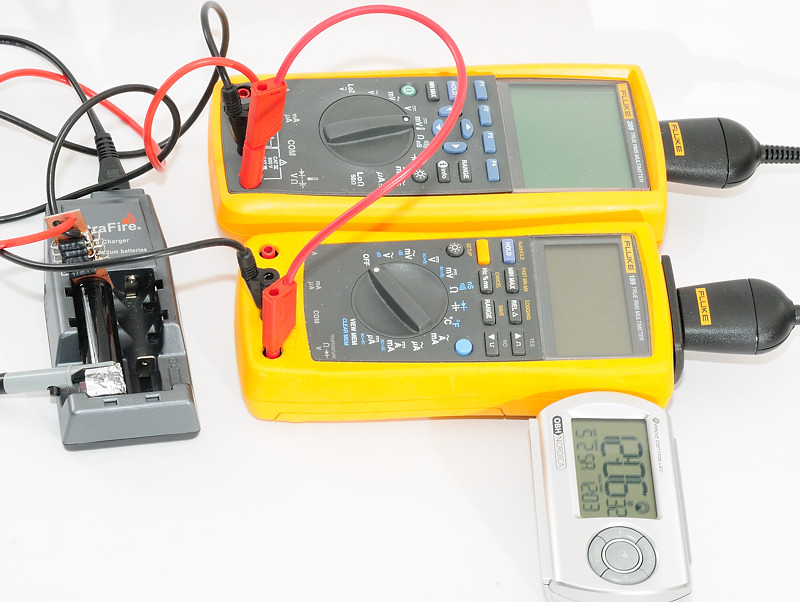
The solution was a video camera on time lapse setting, taking a picture each second. Instead of using the video time, I placed a clock besides my meters, i.e. the video records the charger lamp, both meters and the clock
I seldom uses the camera anymore, the above adapter with a photo resistor (LDR) connected to a DMM and included in the logging is much easier to use. The LDR must be place right over the red/green led and will have a significant resistance change when the led goes from red to green. I never includes this curve in the final charts, but only place a yellow line where the charger says battery full.
Recording a charge curve
I only uses the clock when I uses the video.
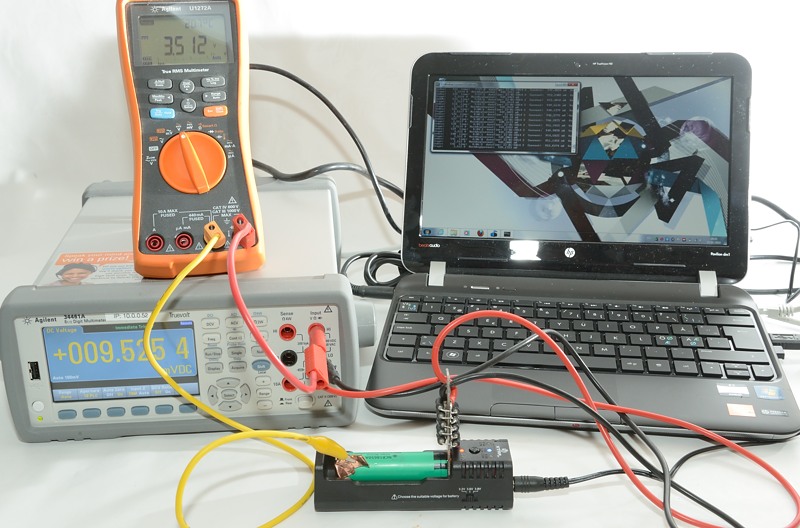
Over time I have changed the equipment a bit, above is another setup with other DMM's and a laptop computer to do the recording.
I do sometimes add one or two more DMM's one for a photo resistor and one for temperature recording.
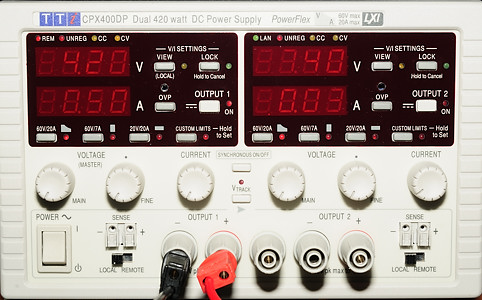
When measuring DC input current I uses one of my computer controlled power supplies as DC supply.
Charging curves
Charge charts usual contains the battery voltage (red), the charge current (Dark green) and a summation of the charge current (blue), with pulsing chargers this summations may not be very precise.
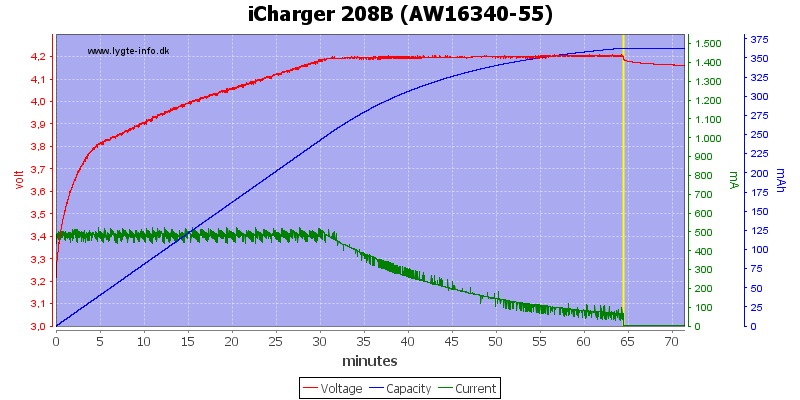
This is the way a LiIon charge curve is supposed to look. The current is constant until the battery reach 4.2 volt, then it will slowly drops while the voltage stays at 4.2 volt. There is a +/- 0.05 volt tolerance on the 4.2 volt. At the yellow line the charger reports charging done, it will usual be at the same time that the charger stops charging (But not always).
%20%231.png)
This is a NiMH (eneloop) charged with pulsing current. The dark green charging current is jumping between 0 and 2.8A all the time, making it impossible to see the average charger current. The light green curve is a calculated average of the dark green curve and will give an idea about the average charge current. The jumping up and down of the average current is due to interference patterns, not actual variations in the current.
The reason for the thick red voltage line is also the jumping current. The underside of the line is the actual battery voltage with 0 charge current.
The charger stops due to voltage (1.48 volt).
%20%231c.png)
The same charger, but with different settings. This time it stop due to -dv/dt: The underside of the voltage curve has dropped slightly below the maximum, when the charger stops.
In this case the charger does also use a trickle current after it has finished charging. This current is rather high here and is called a "top up charge", the current will be reduced after a few hours.
Input current
.png)
This charger has a DC input connector (Usual 5 volt usb or 12 volt for car usage) and I have supplied it from an external power supply while measuring the current. When doing this I always fills the charger with batteries and select the highest charge current, i.e. the curve will show the worst case current consumption.
On this charger the current consumption increases with battery voltage and constant charge current, this means that the charger uses a buck converter to reduce the voltage down to charge level (This is nearly always the case with 12 volt input and nearly never with 5 volt input).
After the yellow line where the charger stopped, it might also be possible to get an idea about standby current.
.png)
This charger is pulsing the DC input current (The charge current will also pulse) and it is impossible to see the average current.
Input voltage
With USB chargers I have started (Late 2018) testing if they are suitable for use with a small solar panel. This test is only for chargers directly connected to a 5V panel without any battery in between.
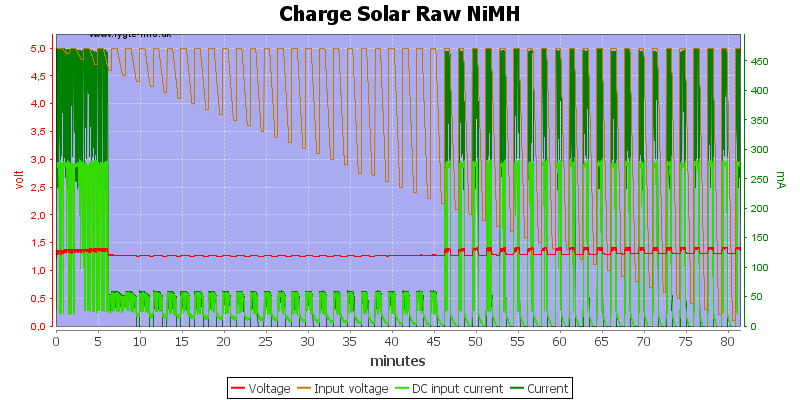
I reduces the voltage a bit and then restores it again, this is done 50 times with 0.1 volt steps, i.e. 4.9V, 4.8V, 4.7V ...
When the voltage returns to 5V I check if the charger resumes charging correctly. All these cycles is recorded in the above curve, but it is rather hard to read.
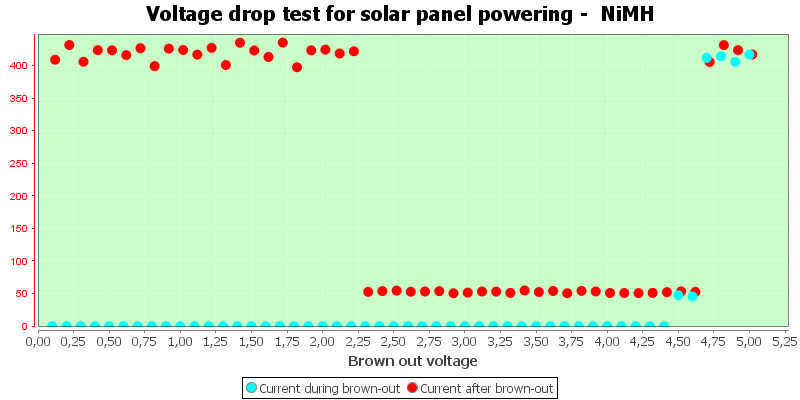
Instead I make this simplified curve where the actual voltage is listen at the bottom and the cyan dot shows the current during the low voltage, it will mostly be zero, because the charger stops charging when the voltage drop. The red dot is much more interesting, it shows the current some time after the 5V is restored. A charger that can handle unstable voltages will always restore it to full charging current again, but many advanced chargers do not do that. The charger above only charges with 50mA, not the supposed 500mA, making it rather useless with a small solar panel.
The best result is that all the red dots are at the charging current, any red dots at the bottom is a bad sign.
There are basically 3 different problems:
- The charger stops working after a voltage has been low, this is when some red dots are on the zero line. A few dots at the zero lines means it will seldom happen, with many dots at the zero line it will often happen.
- The charger discharges the batteries, this is when the cyan dots are below zero, at a low level will not be a real problem.
- The charger has problem controlling the charge current when voltage goes up and down, this can either be the red dots showing high current or I add blue dots showing high current. The blue dots will usual not be a huge problem, because the high current will usual not last more than a few seconds.
Temperature
I have two ways to measure temperature:
Placing a sensor on a battery. This gives the temperature at that point and allows me to log the temperature.
The sensor gives 10mV/°C, i.e. 0.25 volt is 25°C.
.png)
Notice the final raise of the temperature (black line), this shows that the charge is finished. Due to thermal inertia it will happens later than the voltage peak (Red line).
Part of the temperature raise is due to the charger heating the batteries.
.png)
With LiIon most of the temperature raise is due to the charger heating the batteries.
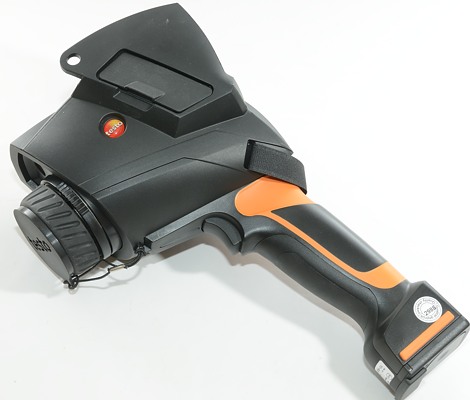
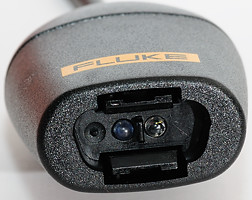
To measure both charger and battery temperature at once, I uses a thermal imager and takes a "photo" of the charger.
In fact, I take a lot of photos, with 10 to 30 minutes between each, then I select the photo where the charger/batteries is hottest.
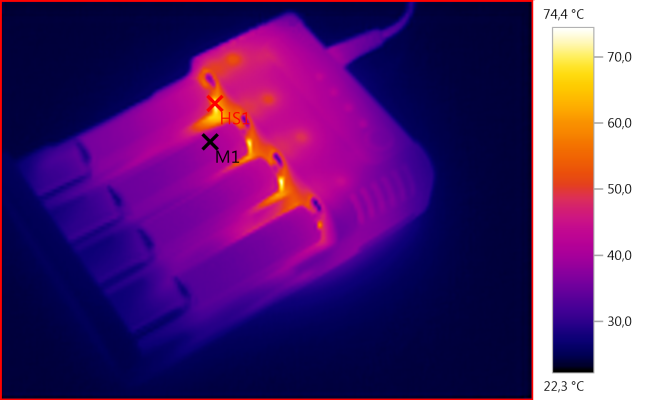
M1: 39,9°C, HS1: 74,4°C
When I have the photo I can mark the points where I want a temperature reading. Finding the hottest point is automatic.
The actual precision on this type of equipment is not very high (Within a few °C).
Batteries are usual rated for a maximum charge temperature of 40°C to 45°C, this is the temperature when starting the charge. During the charge the maximum temperature is 50°C to 55°C (Cooler is better).
Internal resistance
Please see this article on how I test it.
Chargers measures DC resistance
More about DC/AC resistance/impedance
Notes
I have ignored one resistance in the above explanation, the contact resistance. Each connection will have a small resistance and by adding the adapter and the tinfoil I have added two extra connections.
In my test I am always including one old battery, usual a AW16340-IMR. This battery is useful in revealing some bad behavior on some chargers.