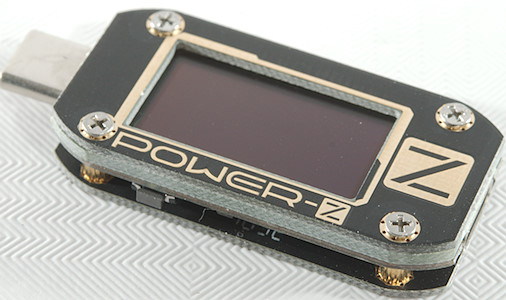
ChargerLab PowerZ KM001C
Official specifications:
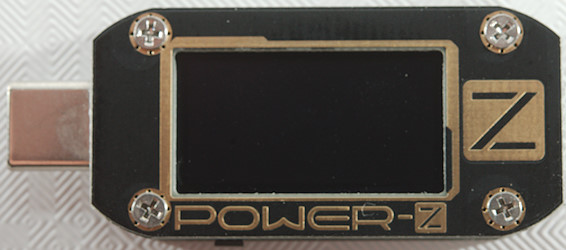
- Screen material: OLED/ pure white
- Screen resolution: 128*64
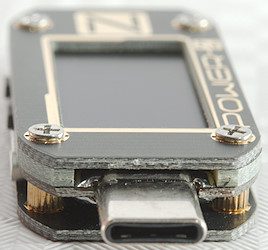
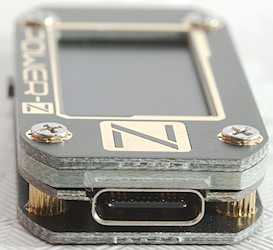
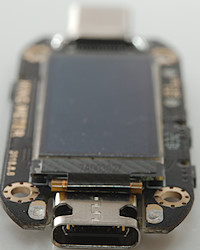
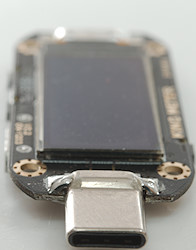
- Interface type: Type-C/USB-C
- Number of interfaces: 3pcs (including one HID port)
- Internal resistance of interface: About 28m ohm
- Independent power supply: HID port (5V)
- Working current: 4-25mA/5mA (standby)
- Voltage precision: 0.10%
- Current accuracy: 0.10%
- Voltage resolution: 0.0001V
- Current resolution: 0.0001A/1uA
- Maximum voltage / rated range: 0-28V/0-24V
- Maximum current / rated range: 0-8A/0-5A
- Offline curve record: 2560x5 group or 12800x1 group
- Number of capacity and energy statistics: 5
- Acquisition speed: 110501001000 times (upper computer)
- USB3.1 transmission: measured 670MB/s
- PD video transmission: Hardware 2.0 above
I got the meter on ebay from dealer: maxmober
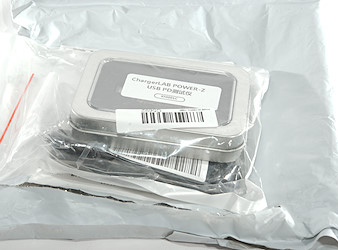
I got the meter in a small metal can.
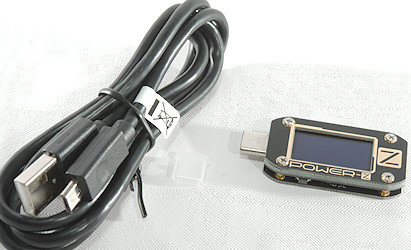
Inside the envelope was the metal can with the meter and a micro USB cable for a computer connection.
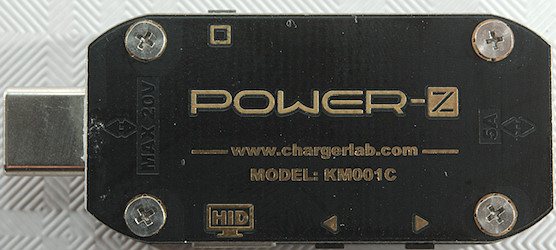
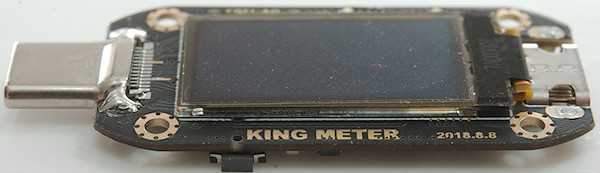
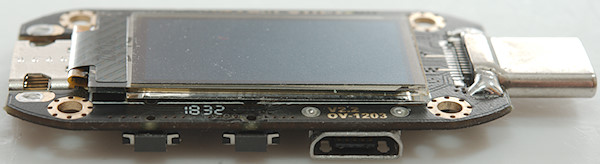
The connectors and buttons are marked on the bottom.
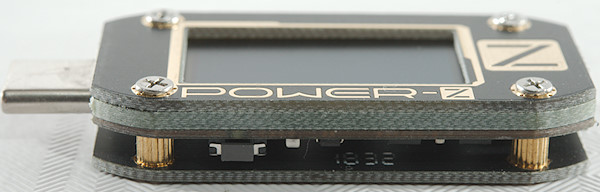
This button is the select/menu button
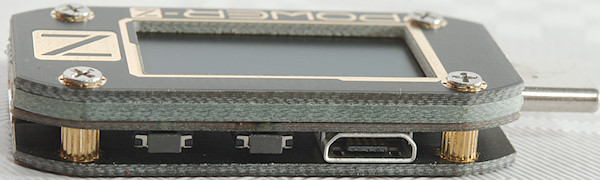
These two buttons are used to change main screen and change values. The micro USB connectors is connected to power/computer and can be used together with the control software and to install software updates.
Display and functions
The meter do not include a manual and is rather complicated to use due to the many functions. In this chapter I look at most functions in it.
At first the two buttons near the micro USB (top buttons) can be used to select between the 6 main screens:
- Voltage/Current/Power/Capacity
- Measure source resistance
- Graph Voltage/Current
- Detect protocol and D+/D- lines
- USB-C protocol monitoring
- Welcome and configuration
Inside each screen the button on the other side (bottom button) can be used to activate functions and then the two top buttons are used to change values, often the right button must be pressed to enter the actual screen.
The last main screen is remembered during power off.
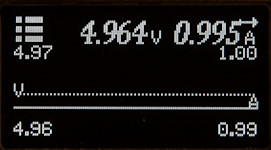
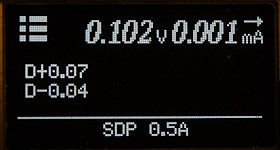
Voltage/Current/Power/Capacity screen
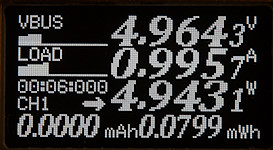
The Voltage/Current/Power/Capacity screen, to start recording hold down the bottom button.
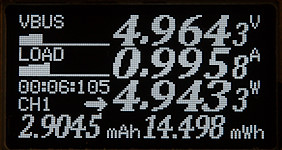
It records with a very fine resolution (0.1uAh and 1uWh).
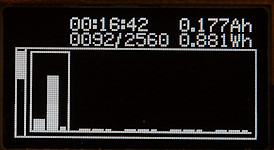
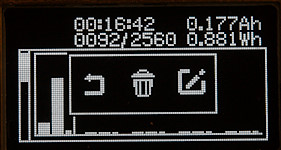
The memories, use top button to move between them, when the sub-menu is present the right top button will select that memory for further recording. This can also be seen on the first screen CH1 changes to CHn where n is the number selected.
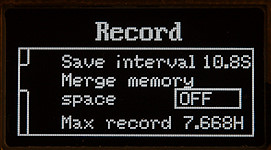
Save interval defines how long time it can record.
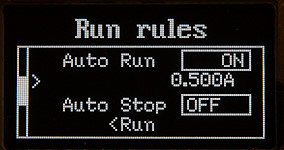
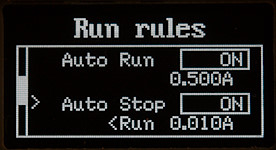
Usual the bottom button must be held down to start/stop recording, but using these rules it is possible to automatic start recording when current is above a specific value and stop again when it drops below another value.
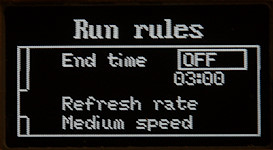
End time is probably how long before a recording will be forced to stop and refresh rate is how fast the display is updated.
Measure source resistance
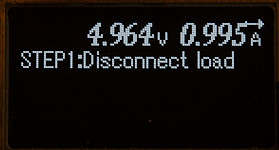
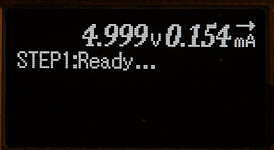
This function is not really a cable measuring function, but a source measuring function. To use it a fixed load must be ready, but not connected.
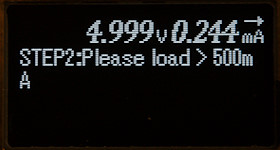
When asked connect the load.
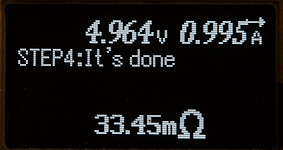
And it will measure the voltage drop and calculated the source resistance.
I was using my lab supply nearly directly connected and got a low resistance, most of it from the USB-C connectors.
Graph Voltage/Current
This screen can show either voltage or current or both graphically, the scale will automatic adjust.
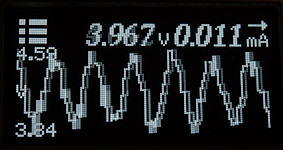
Here I have added 0.54Vpp ripple to the power at 5Hz (This is rather slow), I used maximum sample speed. The meter shows it, but not very precise (It is a nice sine wave from my generator).
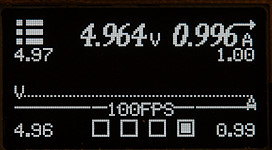
The sample speed can be selected from 1-10-50-100 frames/seconds
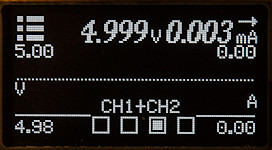
CH1 is voltage and CH2 is current, for fast update speed it is best to only show one of them.
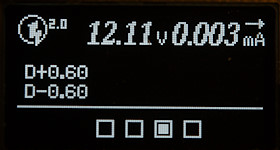
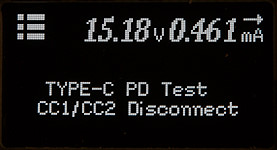
Detect protocol and D+/D- lines
This is for all the old USB protocols hiding in a USB-C connector.
The SDP is "Standard Downstream Port" that is rated for 0.5A current.
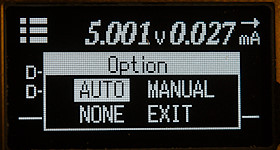
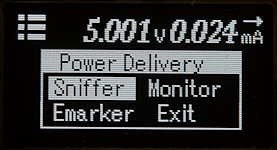
Pressing the bottom button will show this menu.
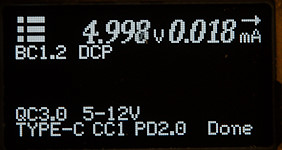
The AUTO function will scan for protocols and list them. It will not list QC2 when there is a QC3 because it is implied in QC3.
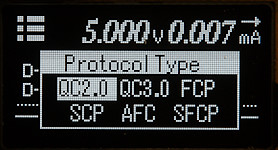
The MANUAL function says sniffering, but I do not know what exactly it does. When finished it list a couple of protocols.
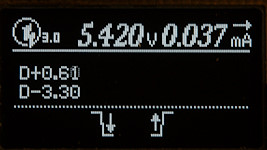
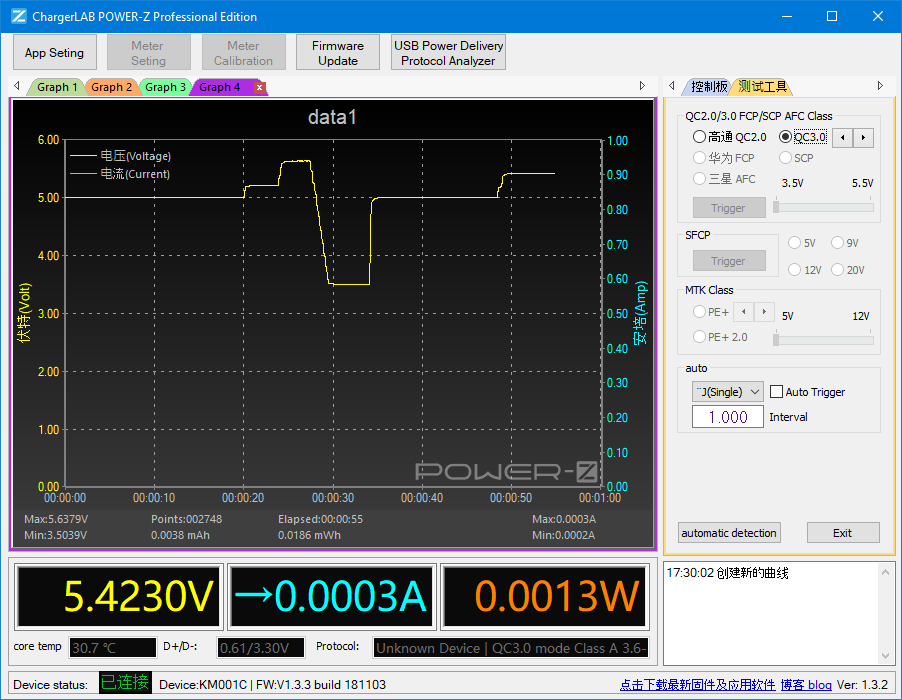
On this charger selecting QC2 or QC3 makes it possible to adjust the voltage.
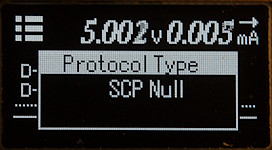
But selecting one of the other protocols do not.
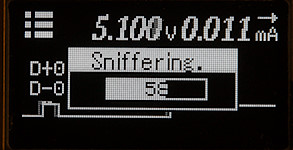
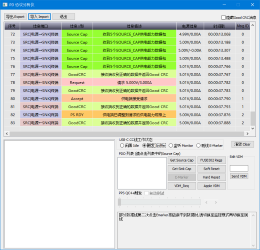
USB-C protocol monitoring
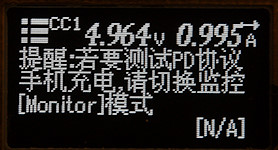
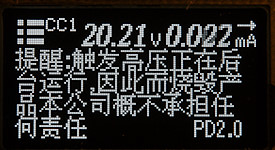
This screen uses the USB-C communication lines to talk with the power supply, this only works if Power Delivery V2 (PD2) is supported.
This is the normal view when connected between a device and power supply.
Connecting this device first and selecting monitor makes it possible to monitor the communication. For this to work external power must be used on the Power-Z.
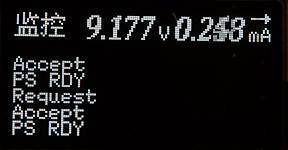
The monitoring is not very useful.
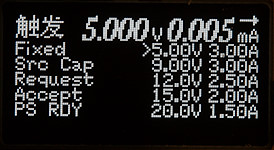
Selecting Sniffer is better, then it is possible to check the different voltages supported by the USB-C PD power supply.
Welcome screen
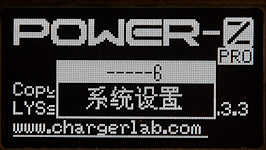
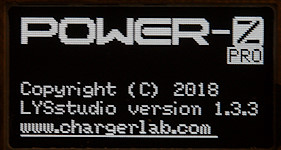
The welcome screen
The different configurations menus.
Measurements
- USB-C output will only be enabled when selecting USB-C and Sniffer or another device on the output do it.
- The usb meter uses about 19mA current with normal brightness (50)
- The internal resistance is about 0.080ohm (This includes both connectors).
- Usb meter will remember measured values when power is removed.
- USB meter uses software V1.3.3
- Fast charge protocols supported: QC2, QC3, Huwai-FCP, Huwai-SCP, Samsung-AFC, Samsung-AFC.
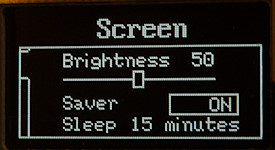
- Brightness and screen saver can be adjusted.
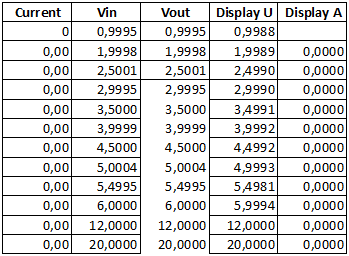
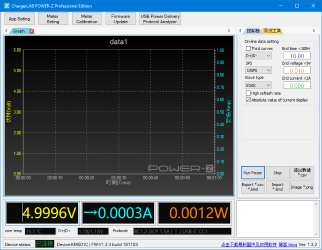
The voltage display is very precise with no current flowing.
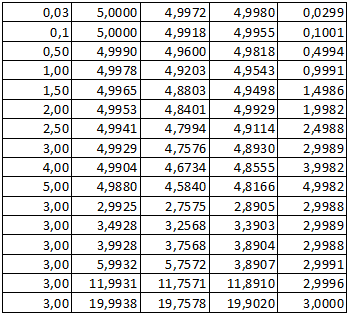
The current display is also very precise and will not change with voltage.
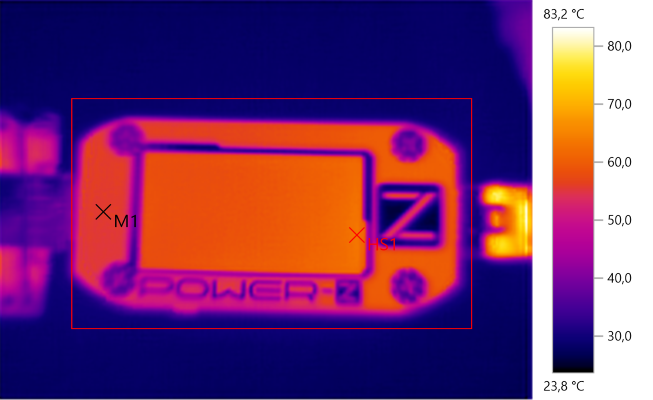
M1: 55.9°C, HS1: 63.7°C
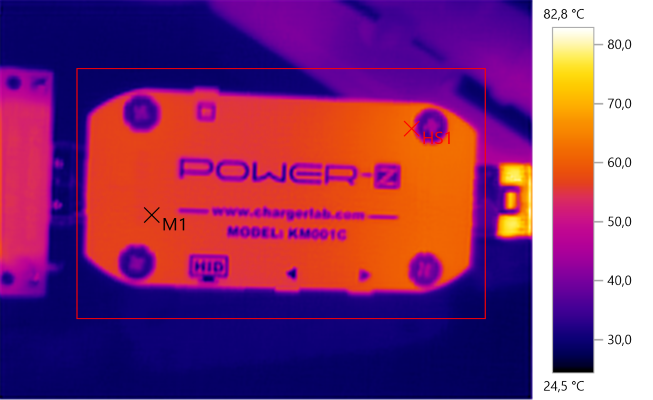
M1: 56.4°C, HS1: 63.2°C
The above IR photo was taken after 30minutes with 5A, during that time the readouts changed less than 0.2%
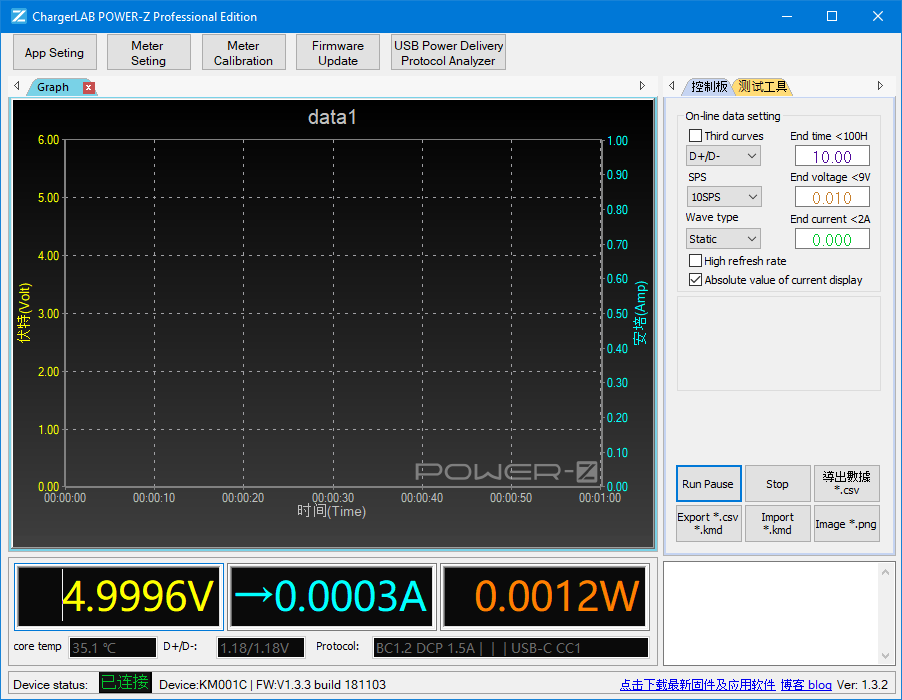
PC application
The PC application is mostly in Chinese, but not totally hopeless to use.
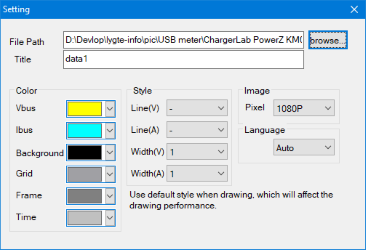
In the "App setting" it is possible to configure colors and save location.
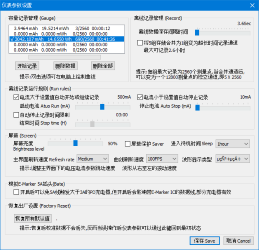
The "Meter Setting" is very difficult to read, but if you check the screens on the meter it is not that difficult to guess.
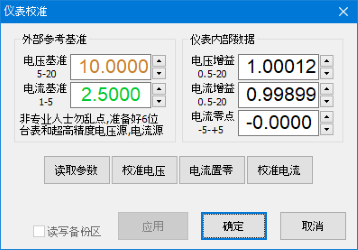
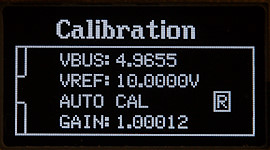
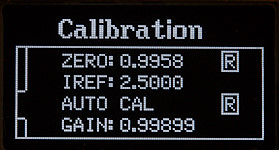
The "Meter calibration" is best to stay away from, it can easy change the calibration of the Power-Z meter.
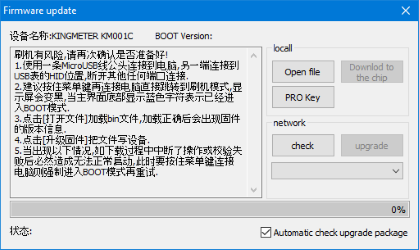
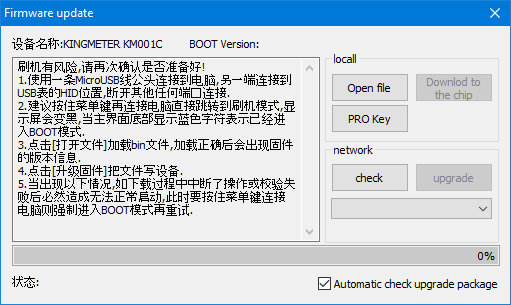
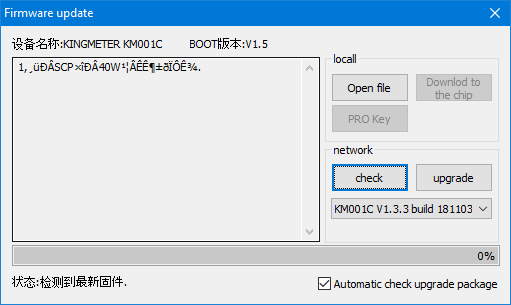
Firmware update is a easy way to update the firmware, just press the check button.
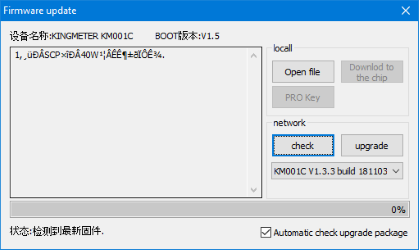
And if a new version shows up press the upgrade button.
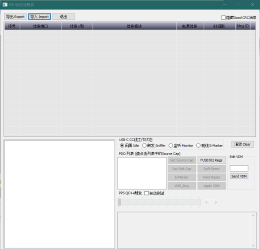
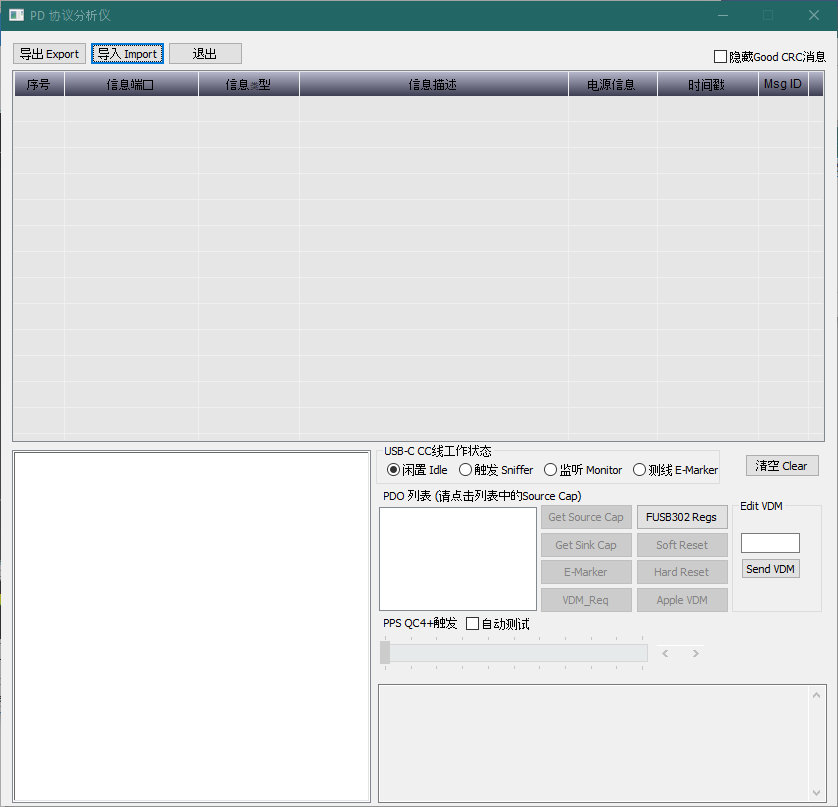
The USB Power Delivery Protocol Analyzer is not easy to use.
Here with some USB-C PD traffic.
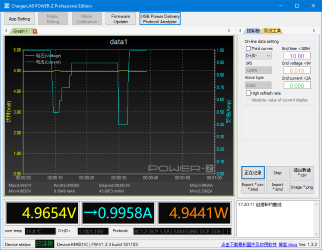
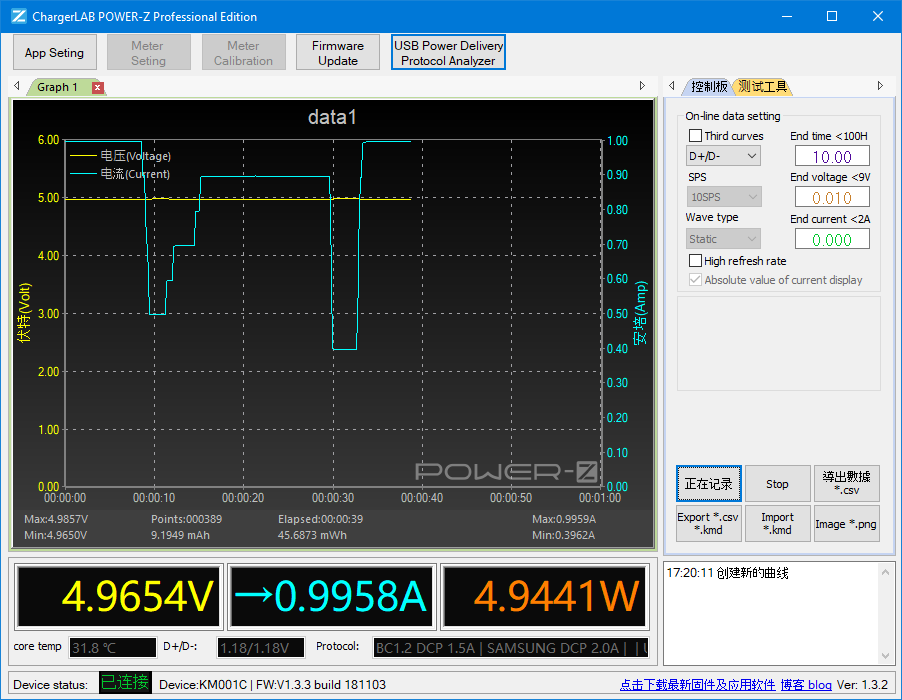
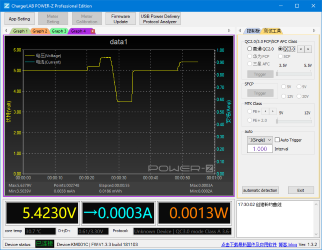
Lets get back to the main screen, here I varies the voltage up/down. The recording on this chart is started from this application and has nothing to do with recording on the Power-Z. It is possible to select up to 1000 samples/sec.
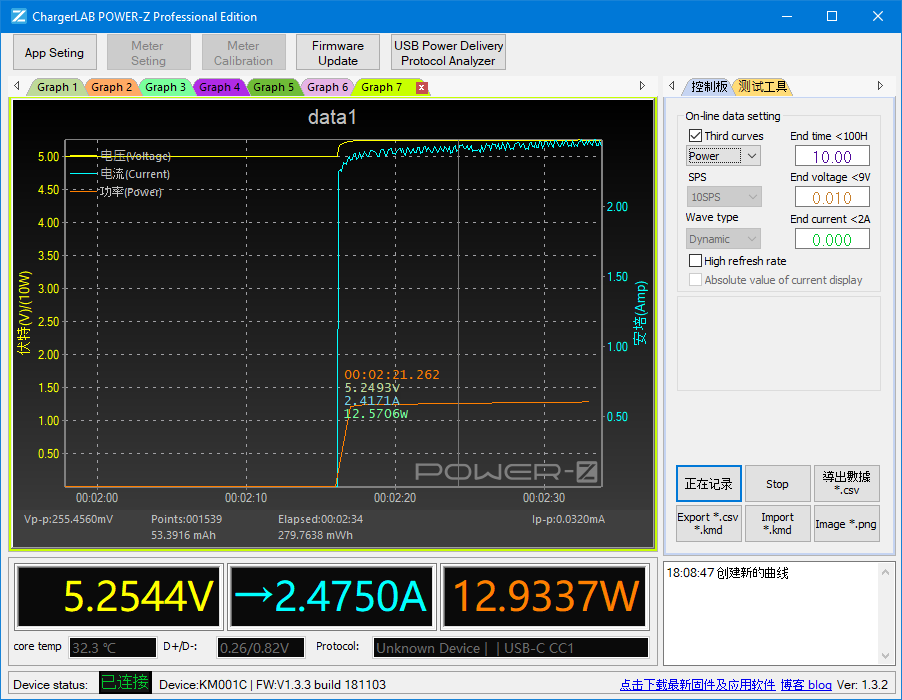
It is possible to add one more curve from: D+/D- (This is two lines), Power, Energy, Temperature. These values are recorded and can be added when viewing the curve, i.e. it is possible to view all of them (one at a time) for a record.
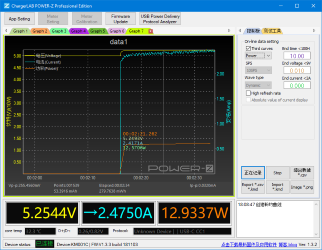
Cursor shows actual values. The scale for Watt is added to the Volt scale, it is 1V=10W.
Color selection for Watt could be better with green numbers, orange curve and yellow scale.
I selected "Wave type" "Dynamic" and that obvious means auto scale.
There is also a panel to control various fast charge schemes.
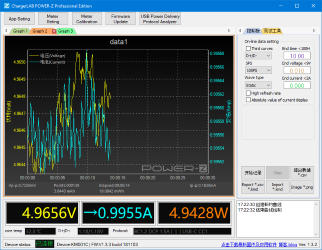
The different curves recording during a session is not discarded before the session ends, the "Graph x" at the top will show them.
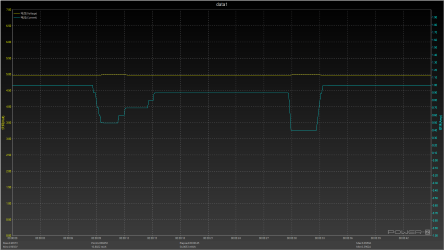
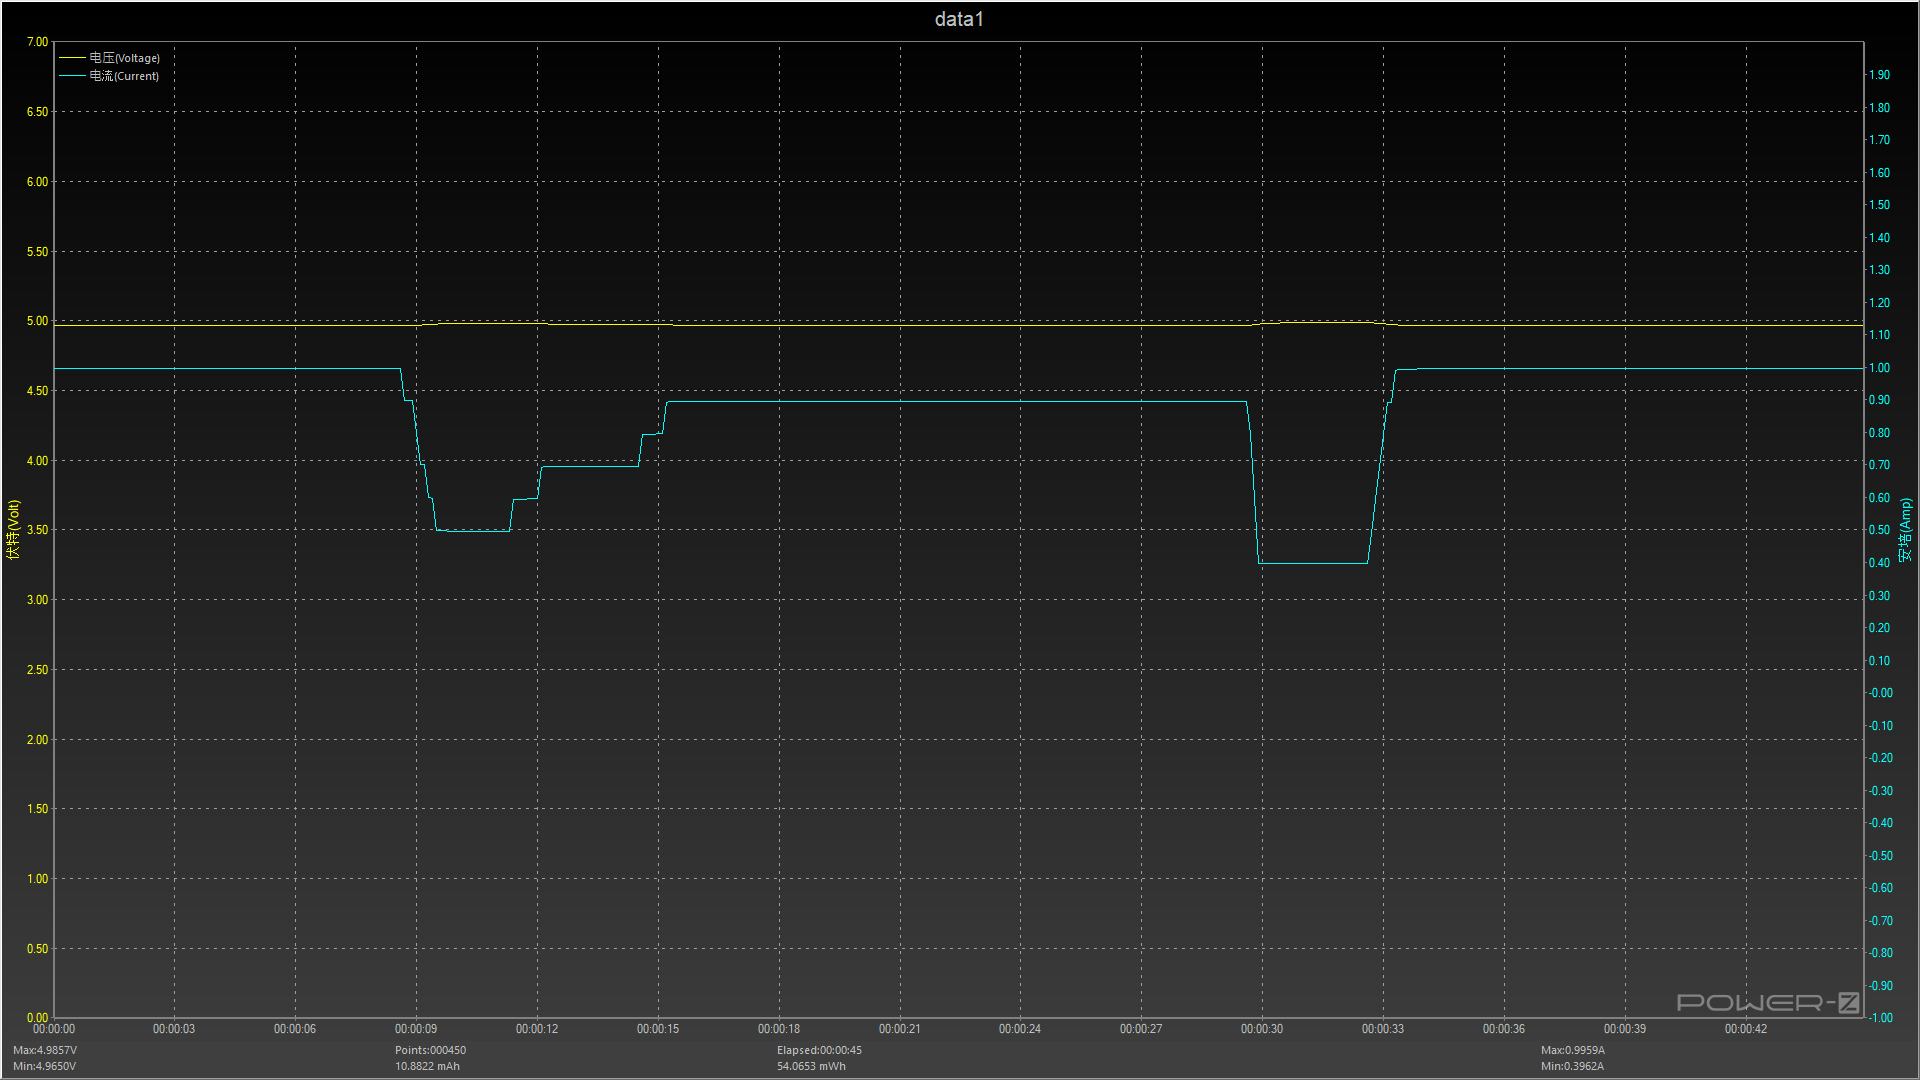
Saved charts are in very high resolution.
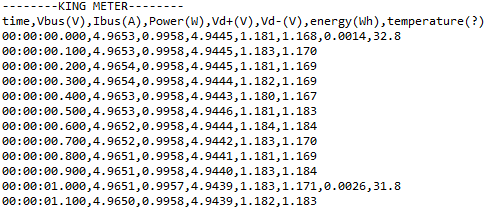
The data can also be saved in csv format, except for the first line it is a good US CSV format.
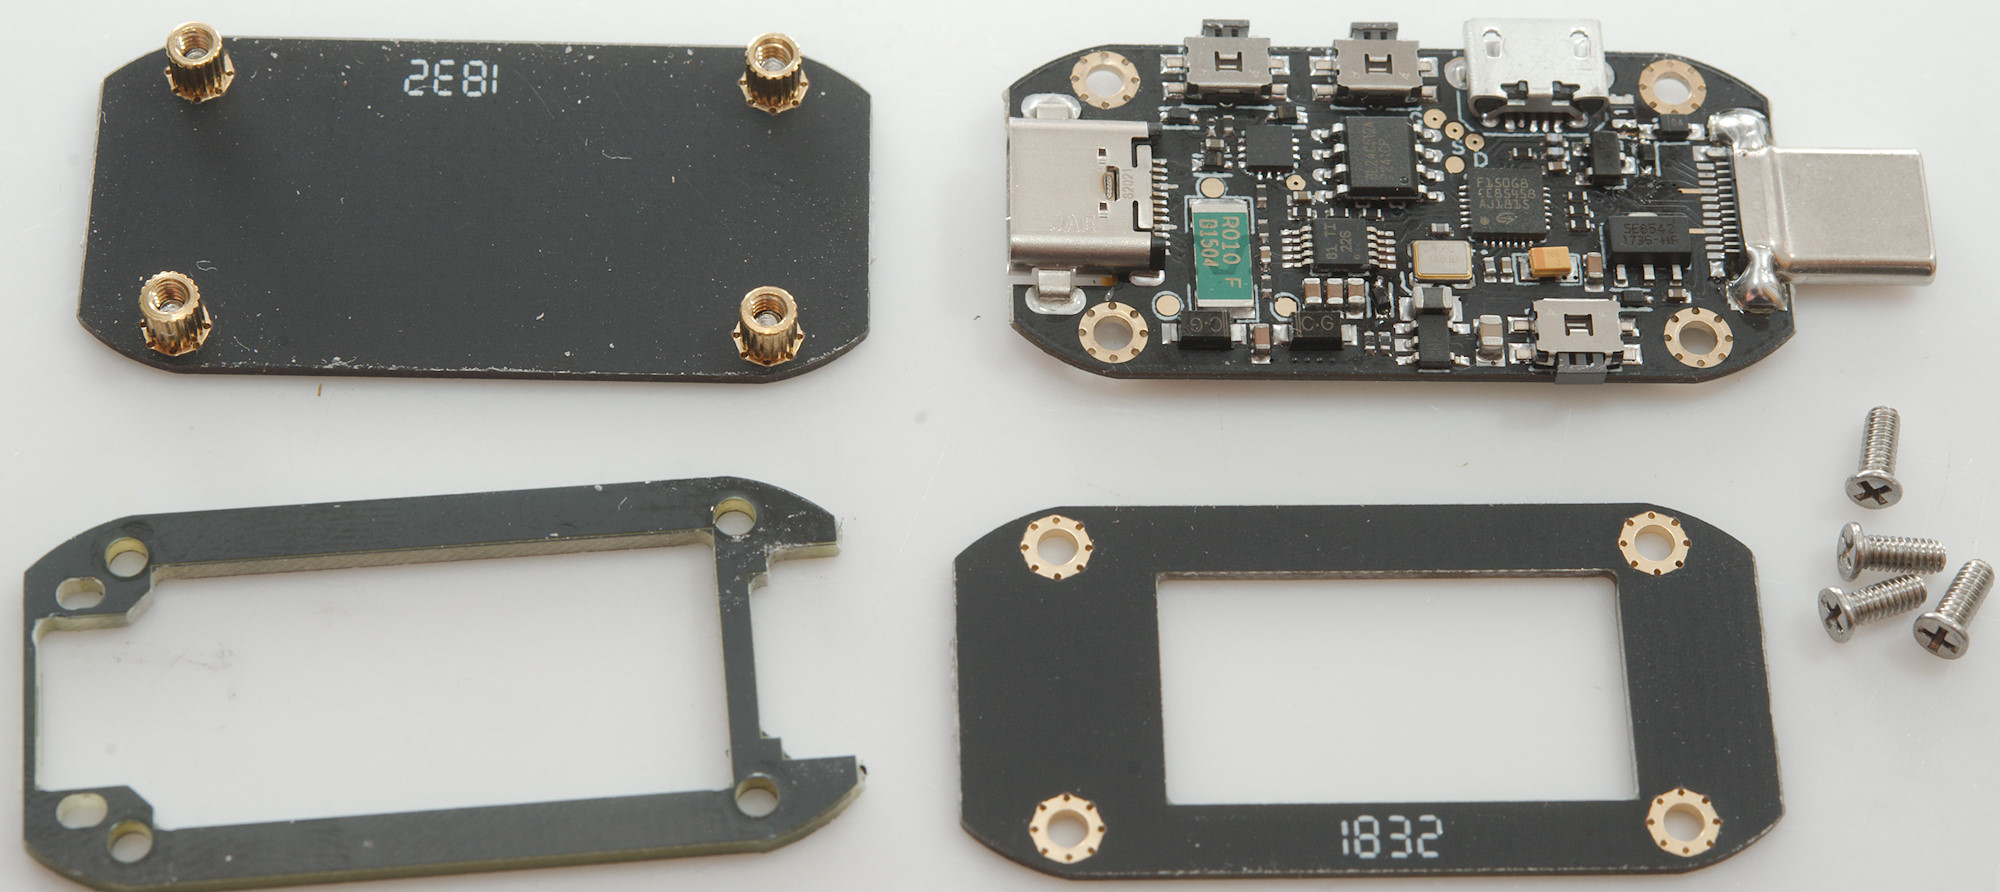
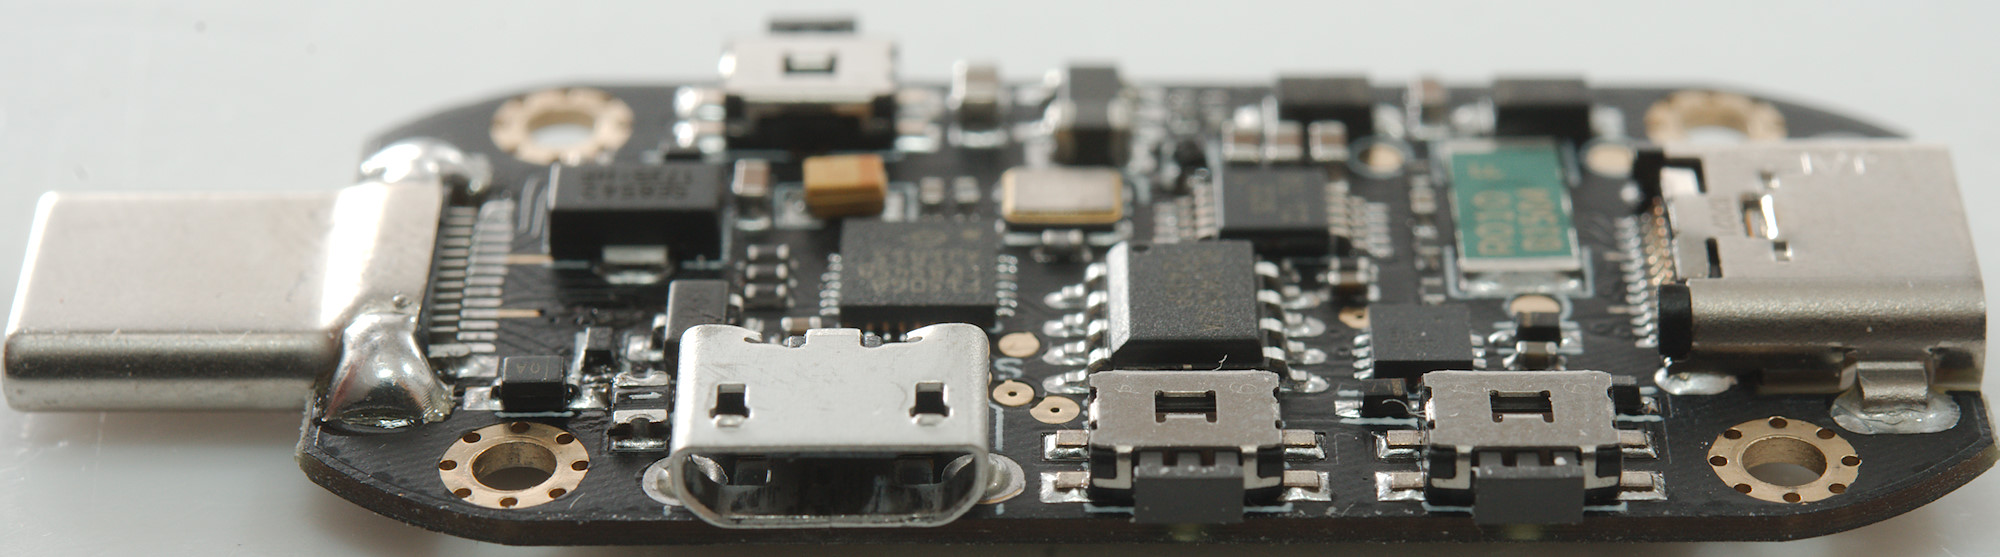
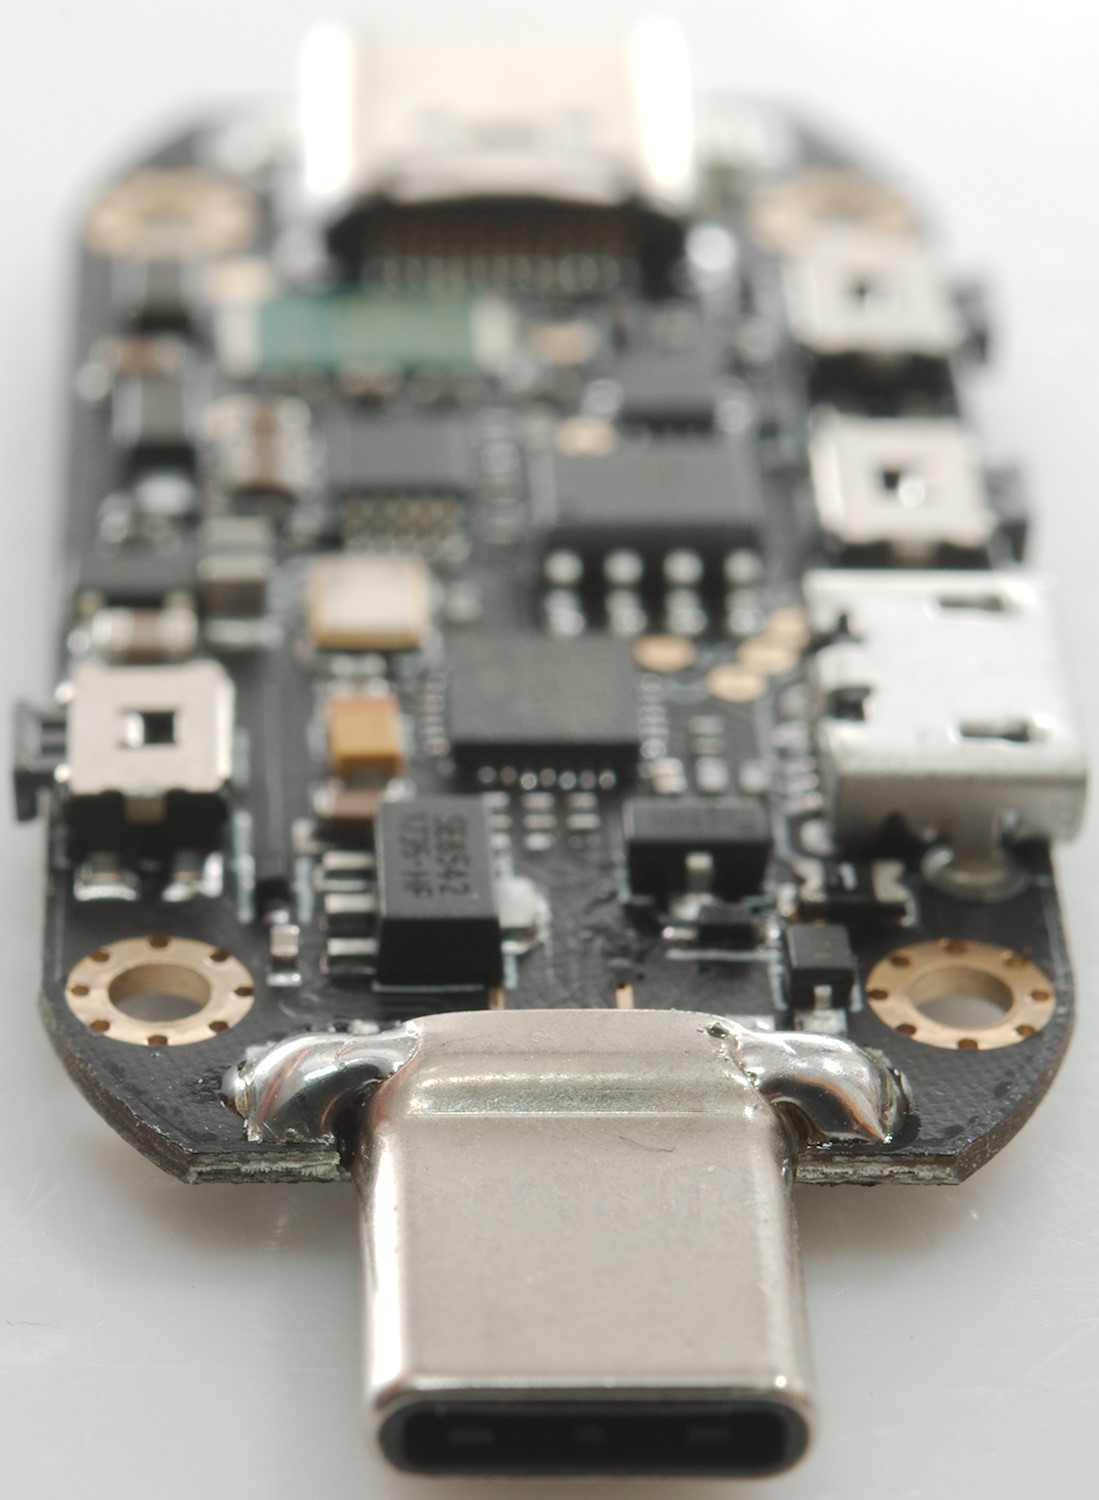
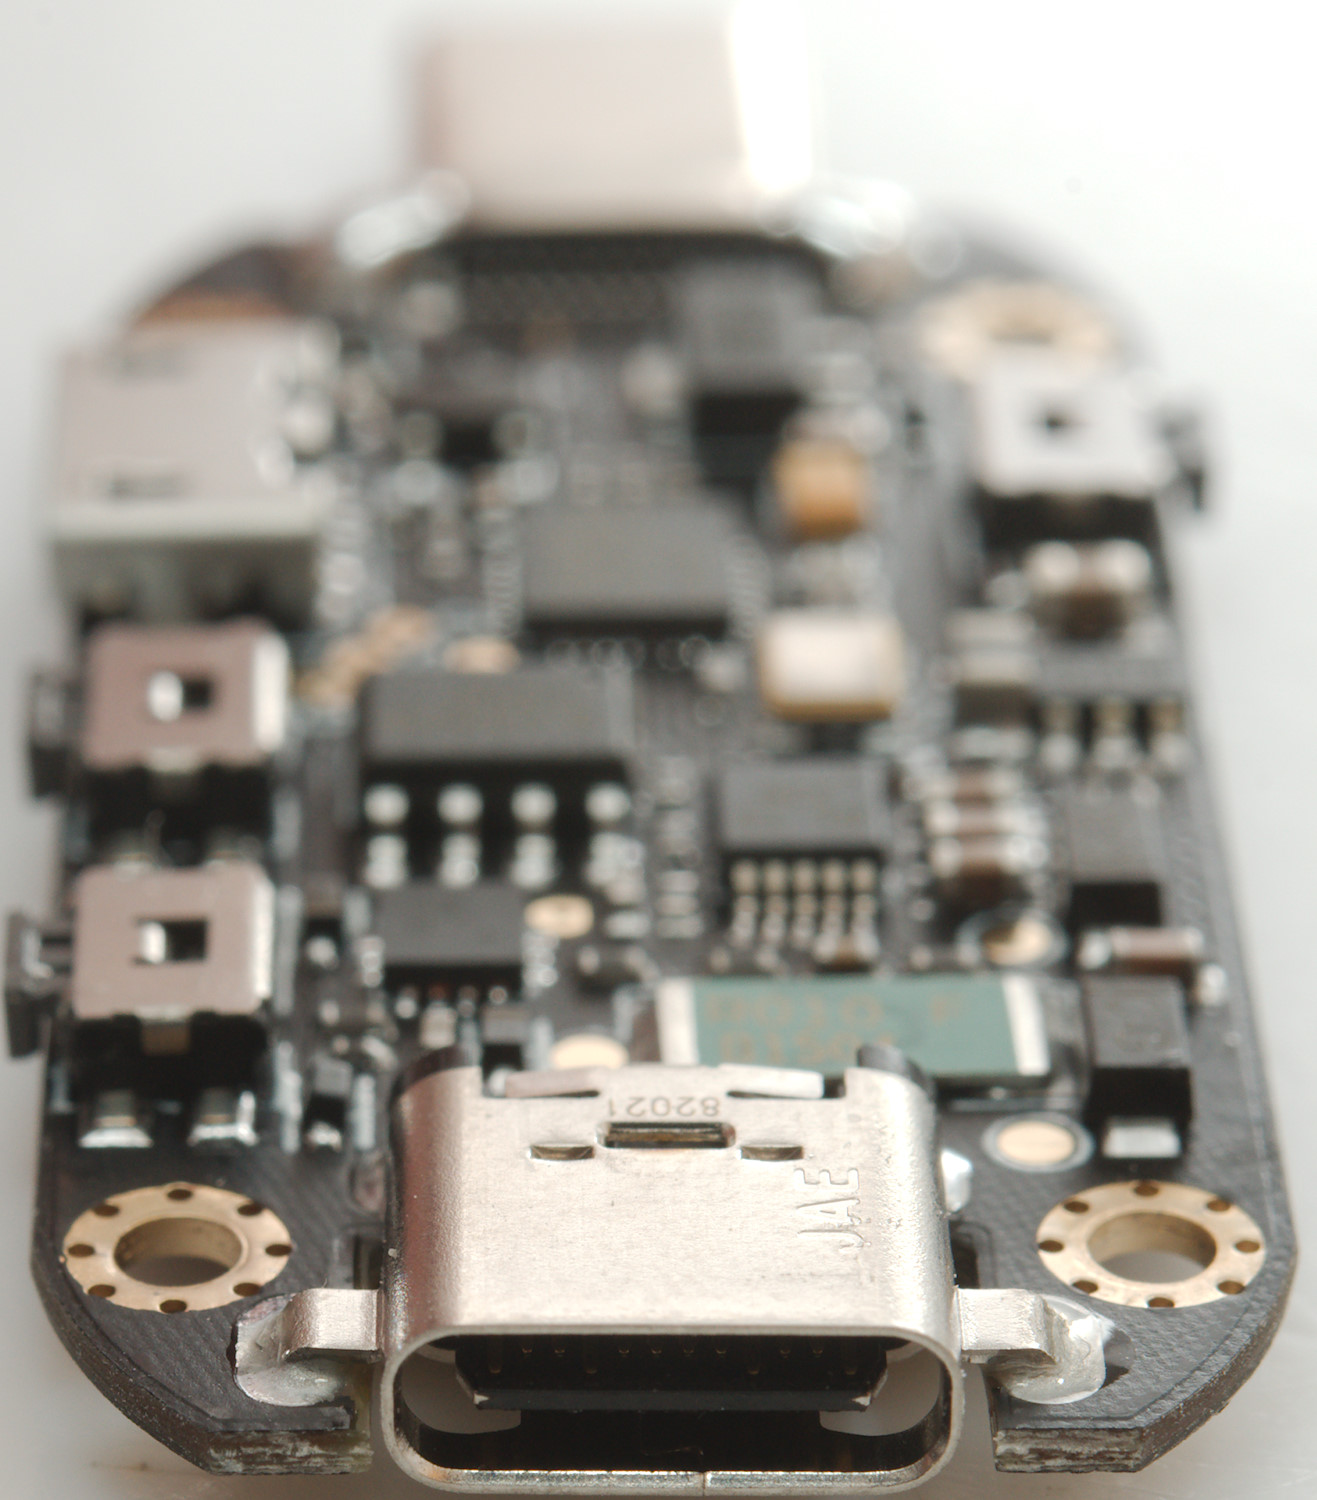
Tear down

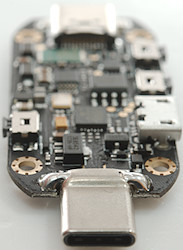
It was very easy to open, just four screws had to be removed.
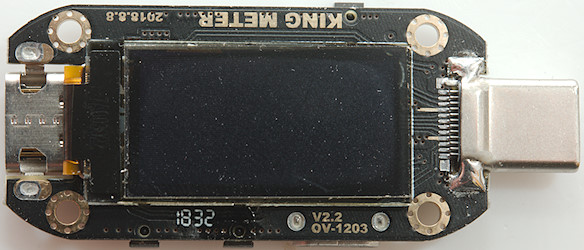
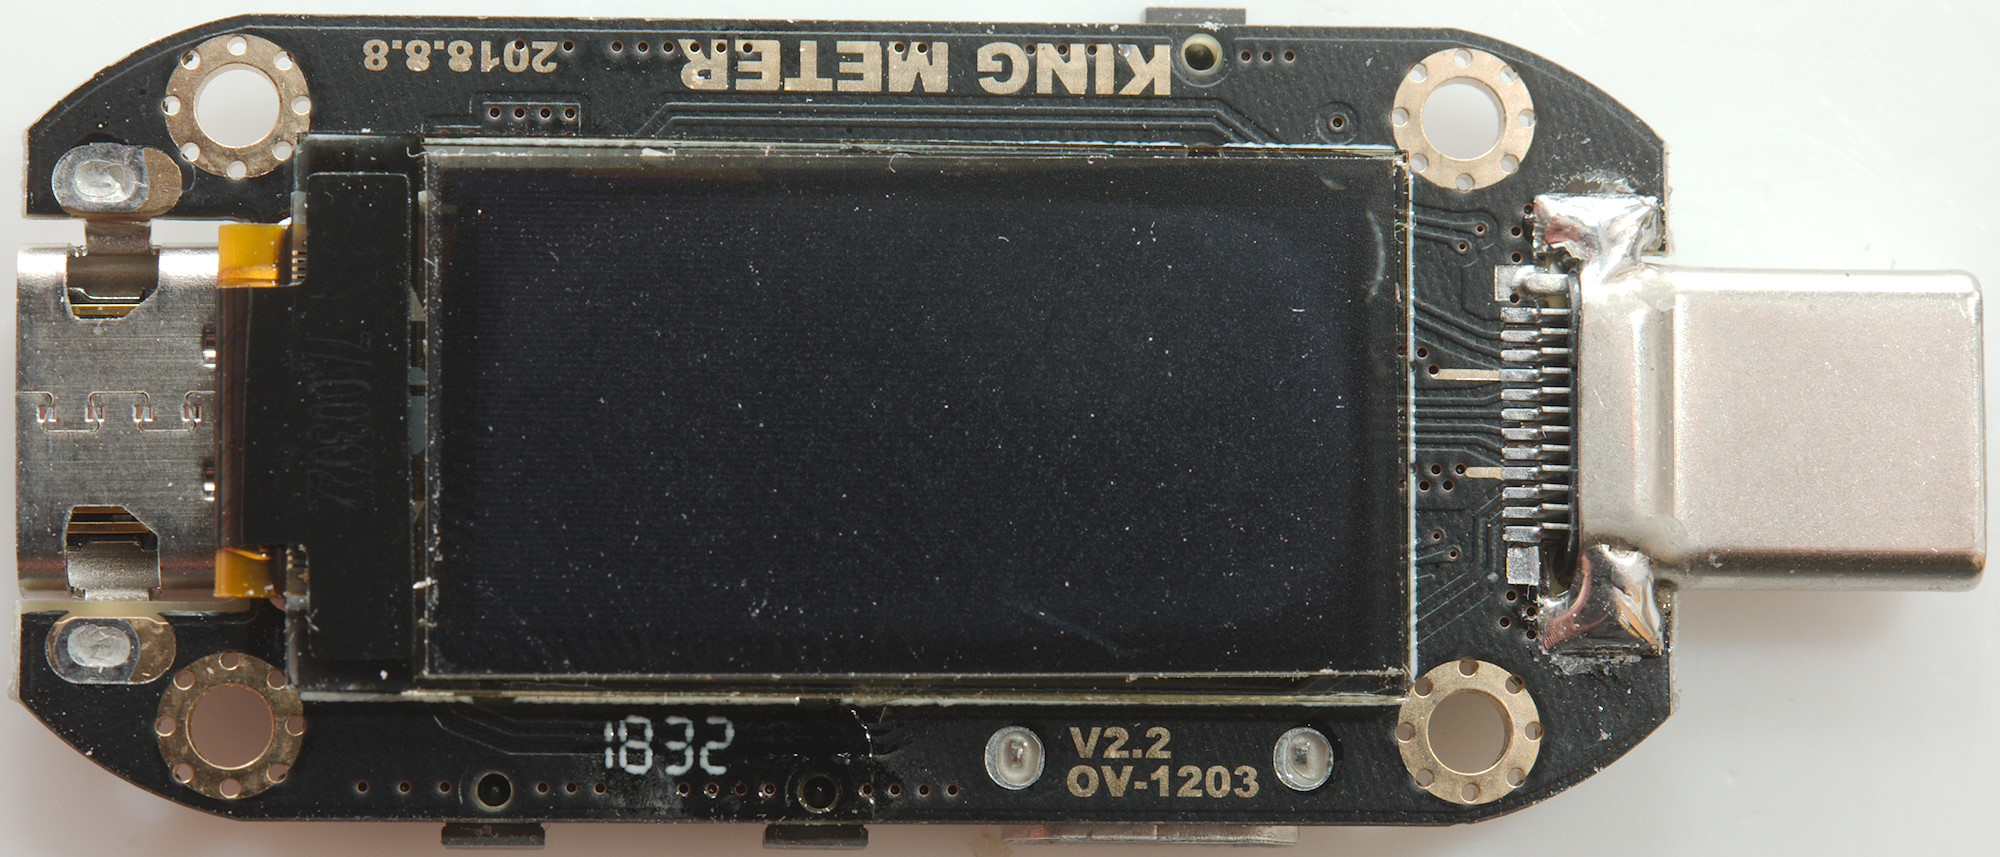
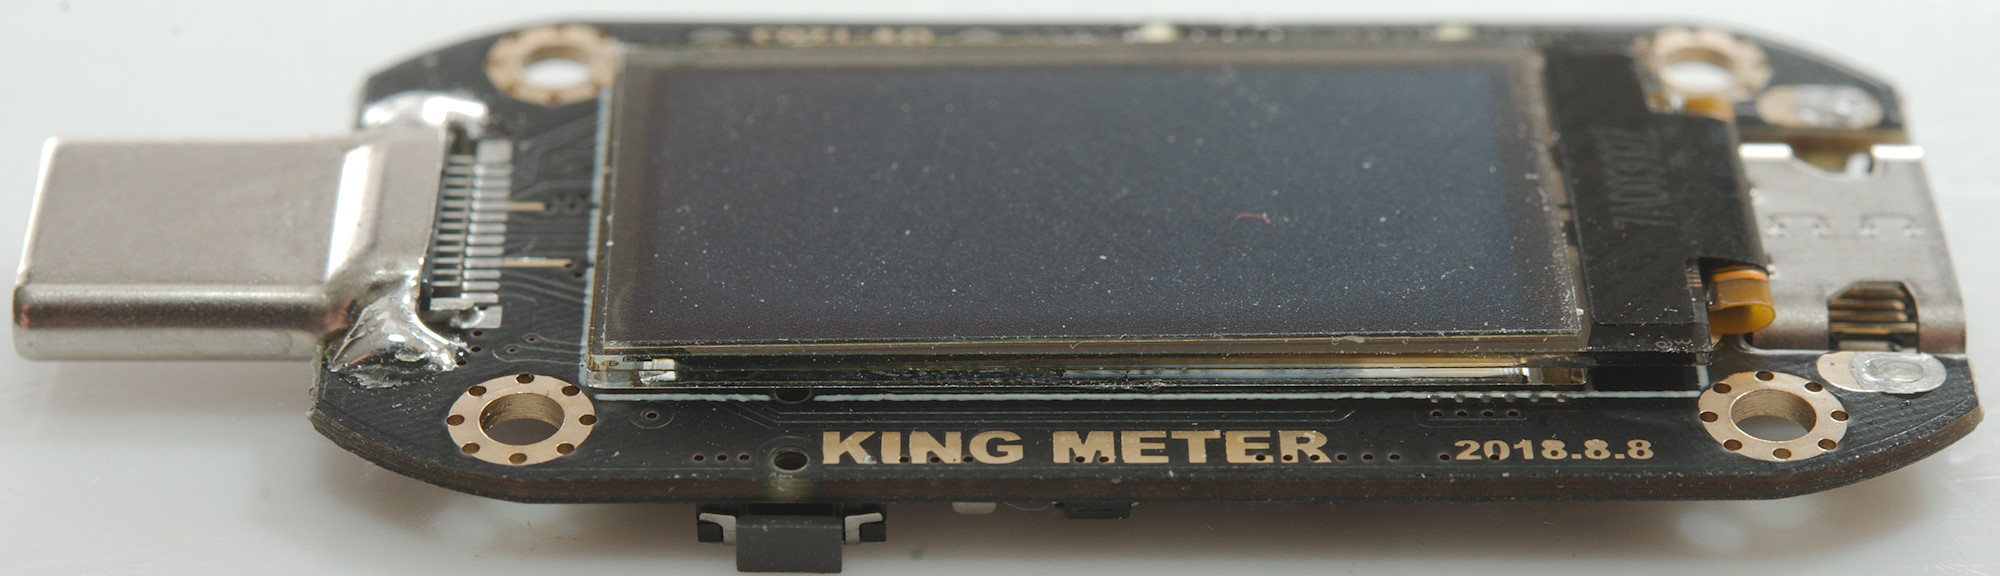
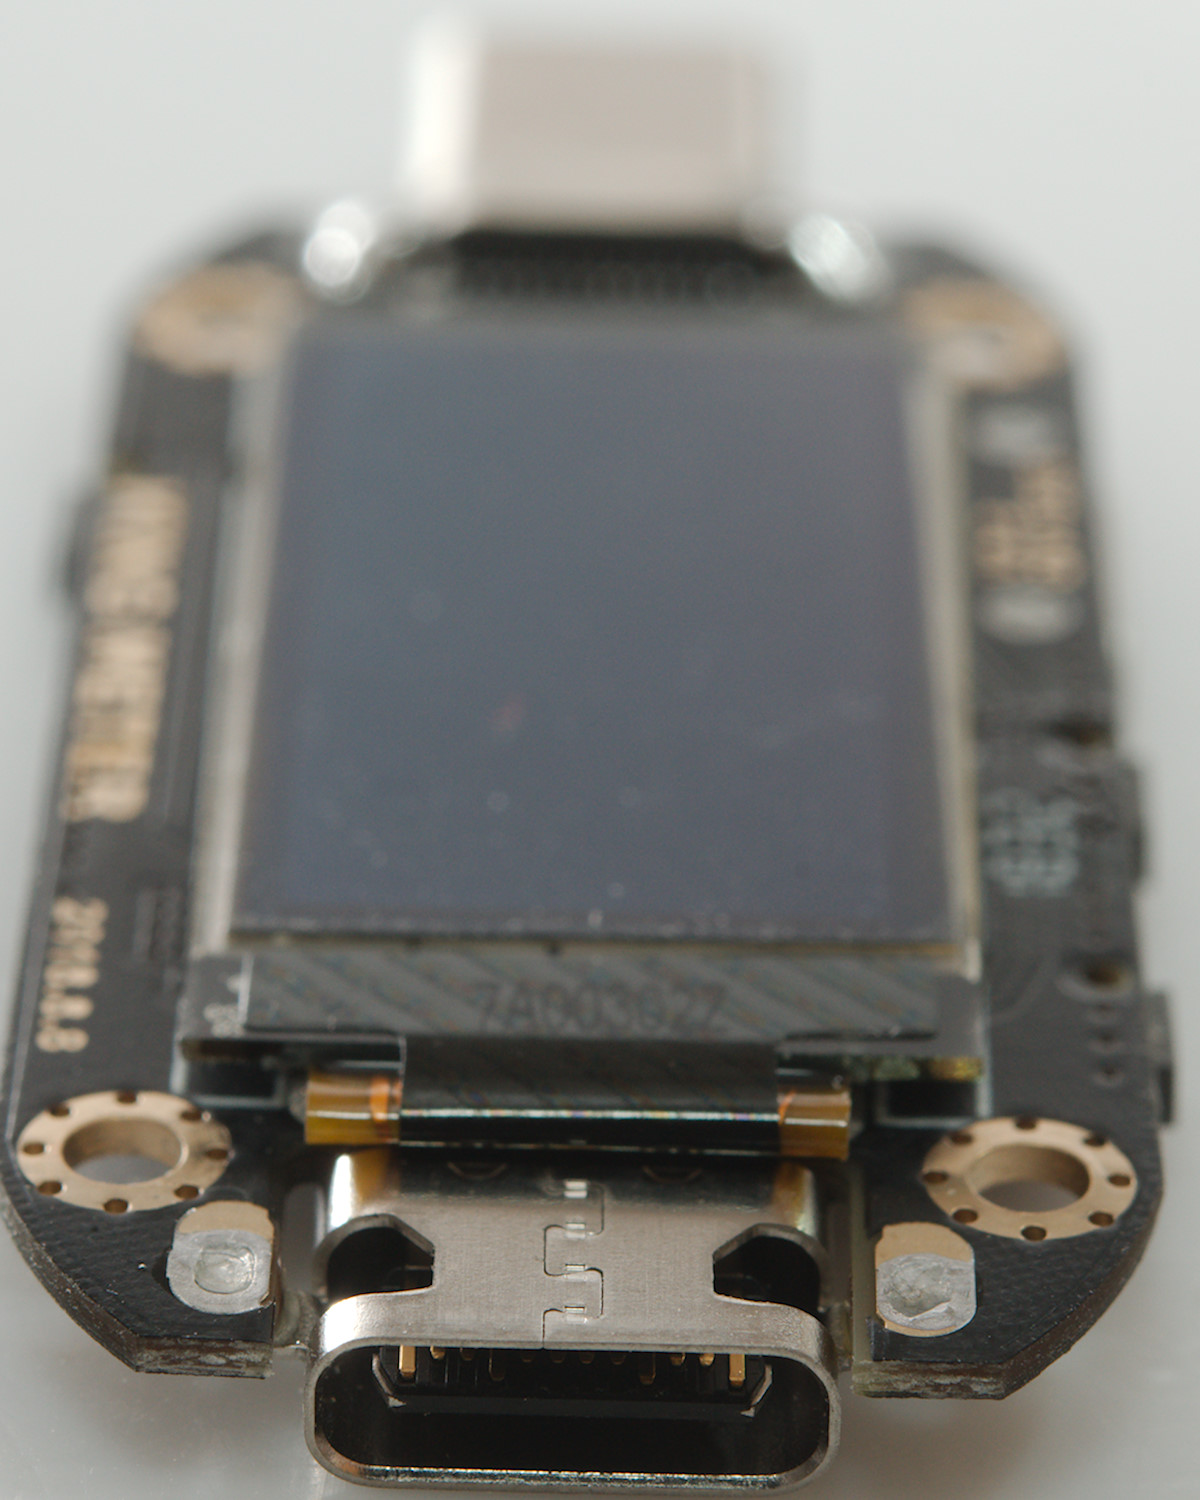
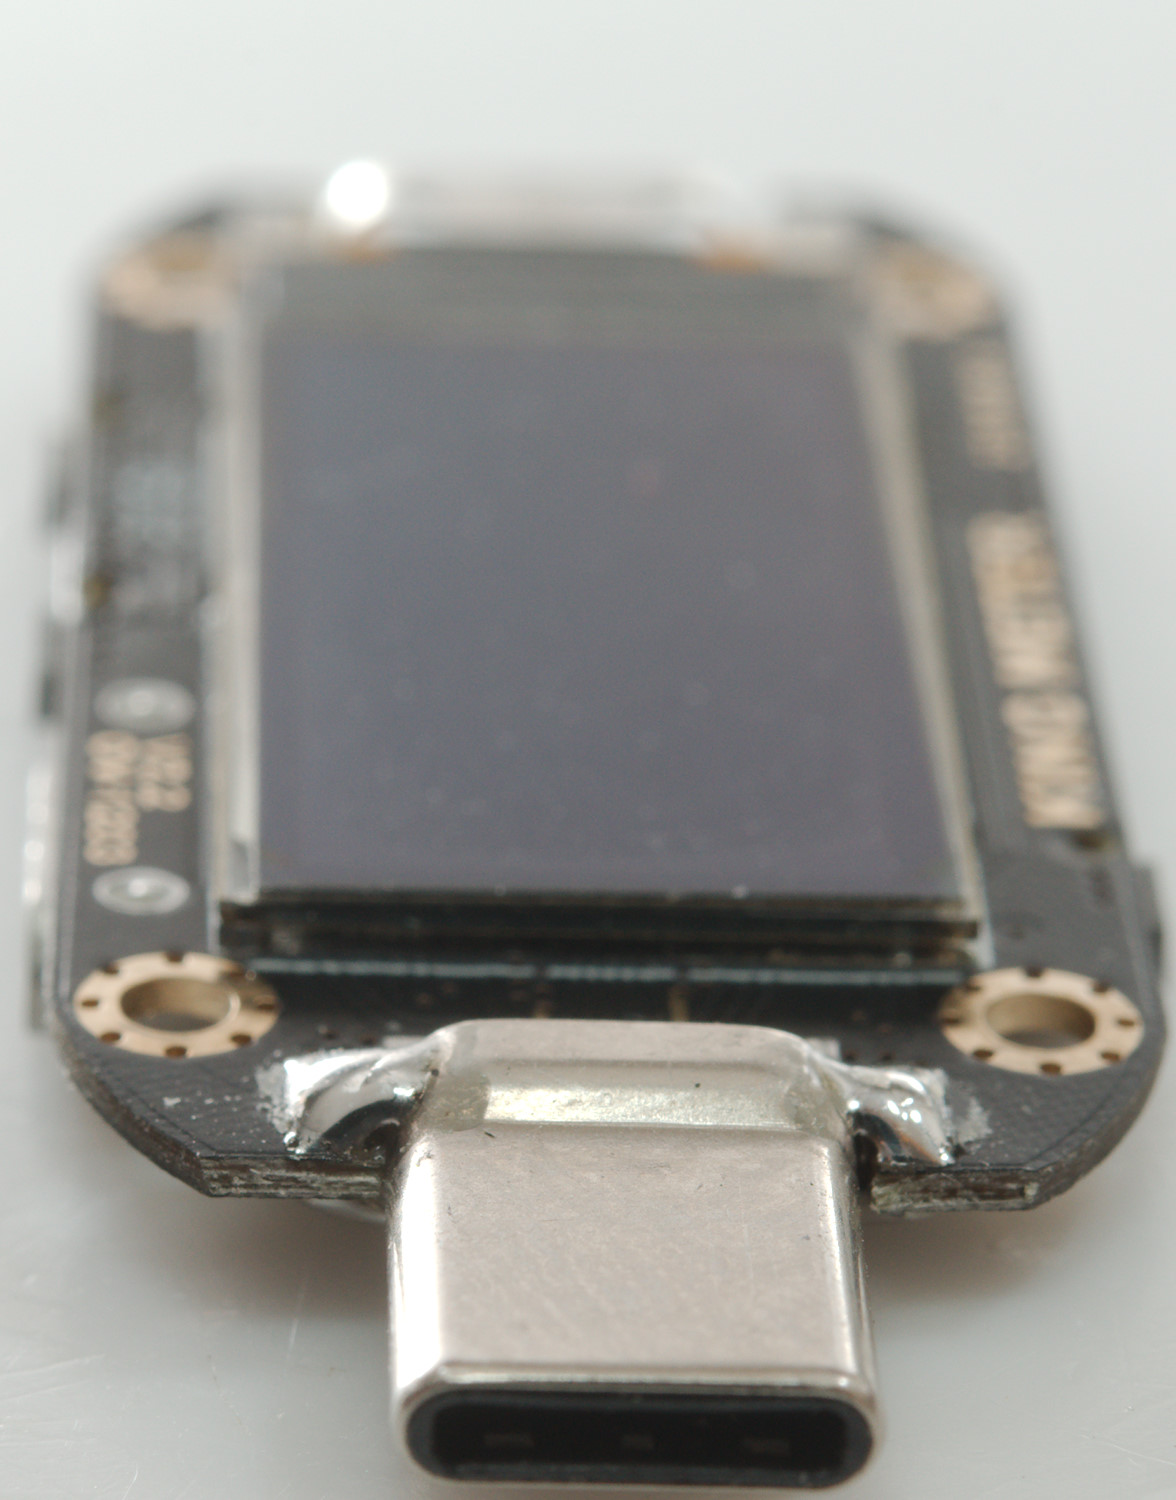
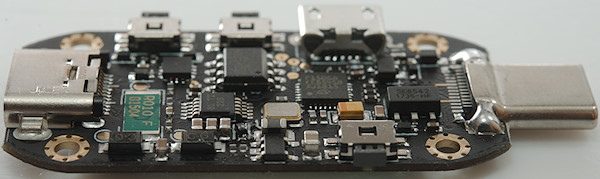
This side of the circuit board contains the display and part of the male USB-C connector.
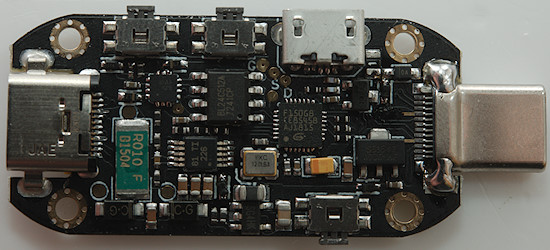
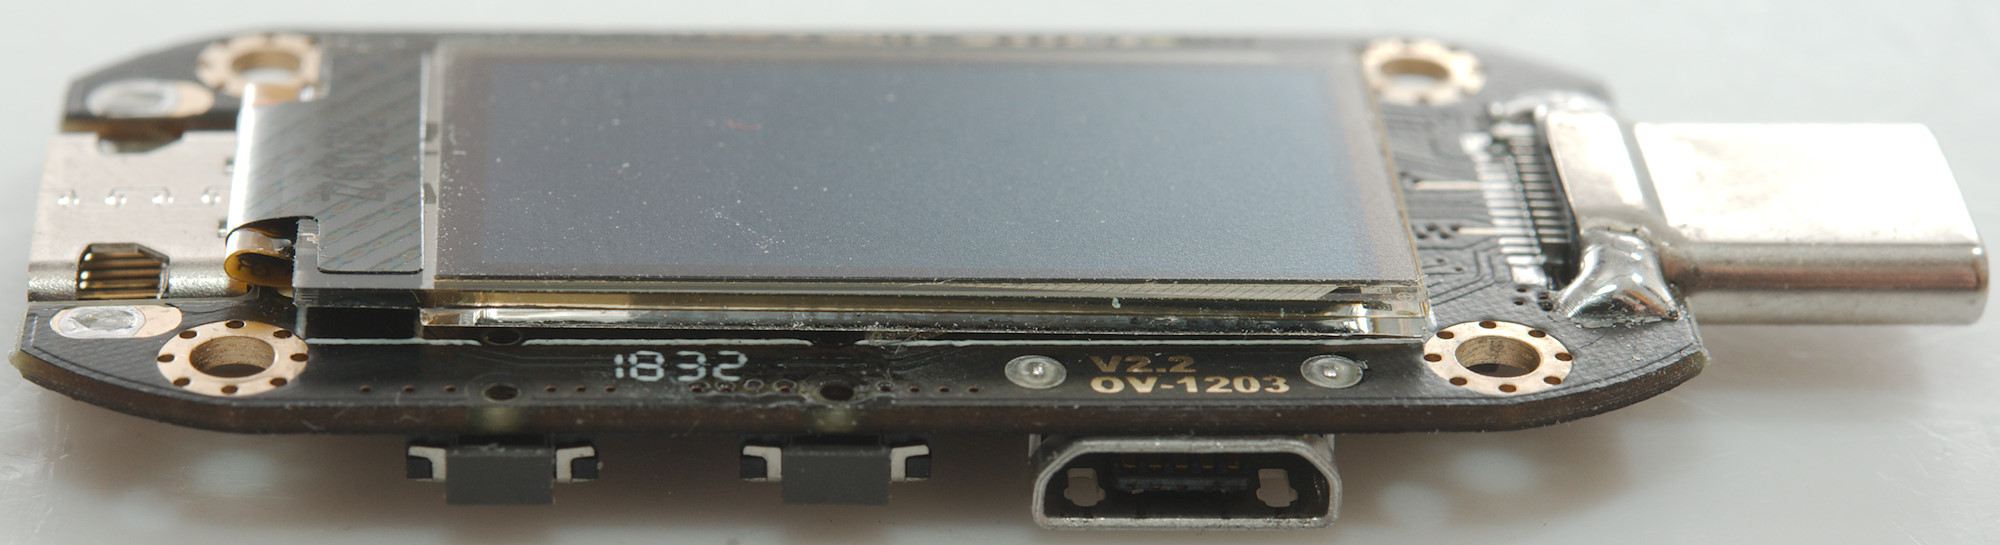
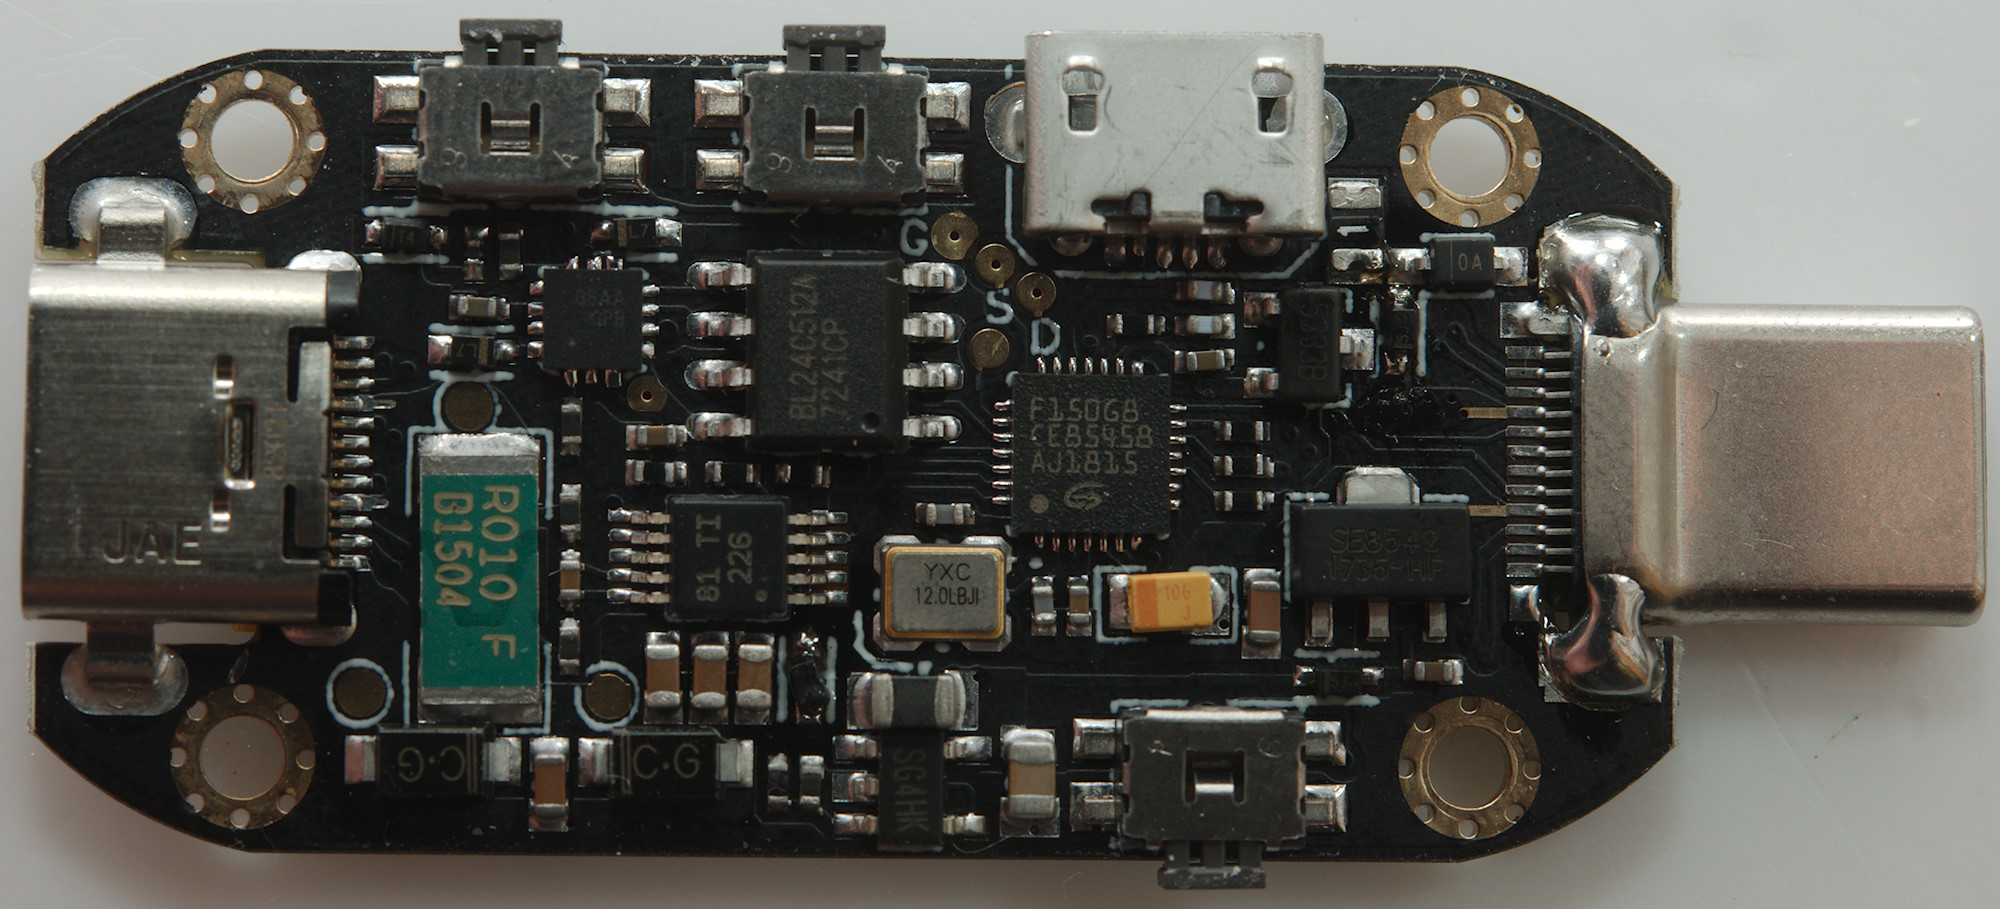
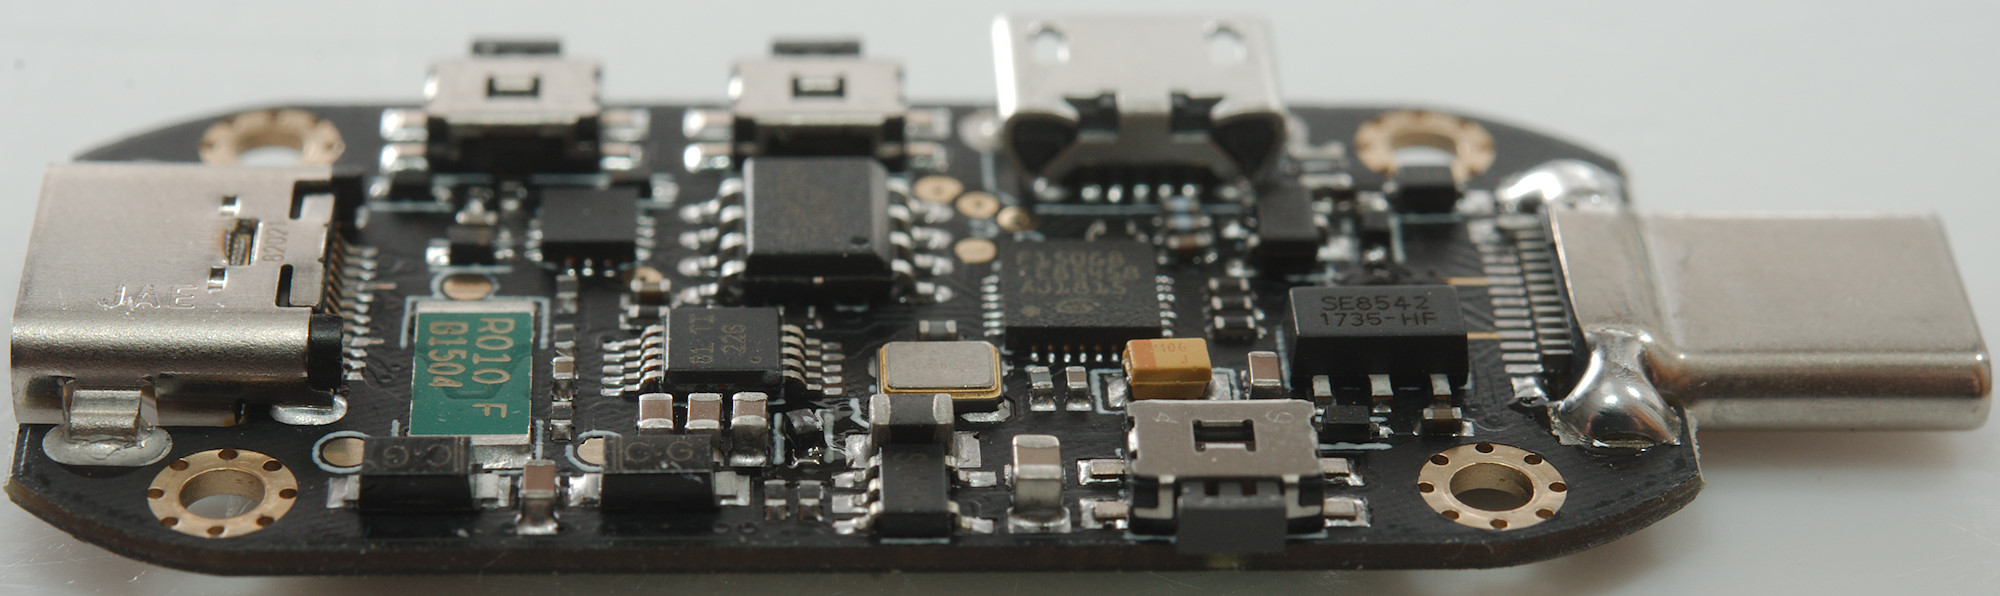
All the electronic is on this side. There is the current sense resistor (R010: 10mOhm) with a supporting current ADC (226: INA226: 16 bit I2C both voltage and current). The is a EEPROM (BL24C512: 64kbytes 1 million writes). The voltage regulator (SE8542: 4.2V regulator) has a bit strange voltage, this must have something with gating 5V from micro USB with the USB-C connectors, the diodes and transistor near the regulator is probably also for this. There is another voltage regulator (SG4HK: 3.3V) with the voltage for the chips.
The main processor (GD32F150G8: ARM Cortex-M3: 64kB flash, 8kB ram, 10ADC inputs, USB-2 full-speed).
The chip marked GSAA is some sort of USB-C protocol interface


Conclusion
This is a very advanced usb meter, with good precision and lots of functions, but more English in the menu and PC program, together with a manual would be a big improvement.
Without this it is still usable, but it requires more to find out of it works (I hope my Display and function chapter can help with that).
This meter has good support for the different USB-C tricks with both PD and the older protocols, but there is some rough edges in the software, I had a lot of software crashes on it when playing with protocols.
At the current time it is one of the best meters for USB-C.
Notes
For these USB meters I used precise equipment (Keithley: DMM7510, 2280S, Keysight: 34470A).
How do I make the test