Test controller, intro
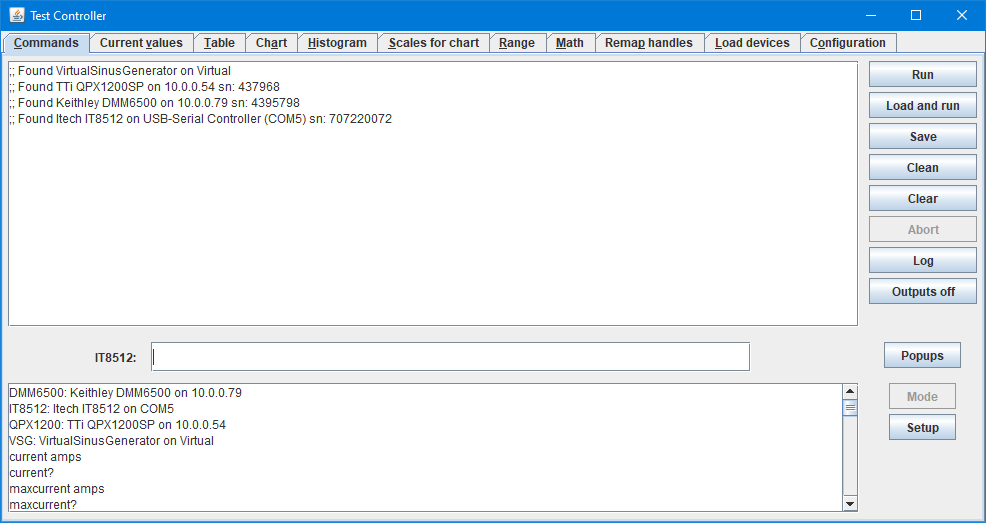
This is software to control and log data from many different devices (Like: DMM, power supplies, electronic load). It is not designed to use devices to their limit, but to run test where different brands of devices is used together and make a common logfile in CSV format from all of them. It can also be used for some data analyses and make charts. There is a versatile toolbox with the popups and the possibility to build custom readouts and controls with the "Grid panel".
It has a command line, but that is only necessary to use for more advanced stuff, for simple setup, logging and looking at data the line is not needed.
TC support scripting, it can automatic generate scripts to restore setups and includes scripts for some jobs.
Contents
Other documents
Installation guide
Documentation for main pages
Documentation for popups
Other documentation
Examples
Commands
Other popups
Current values
Table
Chart
Scales for chart
Histogram
Range
Math
Load devices
Generally
Videos
Conclusion
Notes & Download
Other documents
This document is only a introduction, the documents below will contain more details. Many of them can be access directly from TestController by pressing F1 when using the page/popup.
Installation guide
Installation guide
Documentation for main pages
Commands page documentation
Current value page documentation
Table documentation
Chart page documentation
Histogram page documentation
Scales for chart page documentation
Range page documentation
Math page documentation
Remap handles page documentation
Load devices page documentation
Configuration page documentation
Documentation for popups
Calculator popup
Timer popup
Alarm popup
Adjust scale
Log popup
Export popup
Test interface popup
Connected devices popup
Readout popup
Virtual generators
Sound card devices
Image viewer
Log event
Grid panel & Single panel
Param adjuster
Params sweeper
Import popup
Script list popup
FFT View popup
Timer counter popup
Other documentation
Functions for use in calculator and definitions
Scripting and programming
Script commands
Configuration of a SCPI devices
Configuration of a non SCPI devices
Support equipment, listed by function
Examples
Scripting example
Battery test with resistor
Script for charging a USB charged battery and labeling the chart
Using a Arduino with Test Controller
Using a Arduino with Test Controller, some examples
User scripts
User projects
Commands
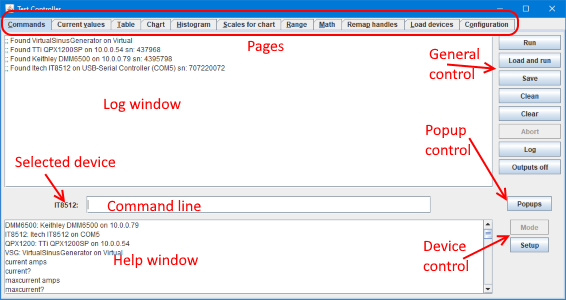
This is the initial screen that is shown, it may look boring, but there is a lot of functions hidden on it. For SCPI devices it will directly pass commands to them, for other devices it has build in command parse, making it possible to control them. The help window will list possible commands for many devices.
For any device that can be controlled pressing the mode or setup button will open a control popup for that device:
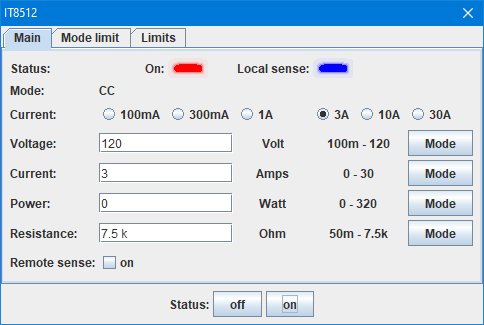
Setup popup for an electronic load (These popups are customized for each brand/device).
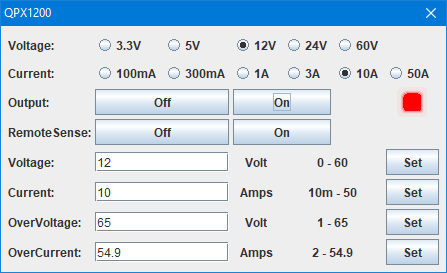
Setup popup for a power supply.
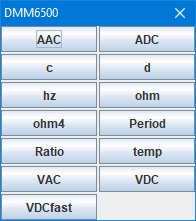
Mode popup for a DMM.
Other popups
TestController has a collection of popups in addition to the above mode/setup popups. These can viewed as a toolbox of functions that can be used for some jobs:

A calculator, it can do all standard operations and functions, including complex numbers. It do also have a some electronic related functions.

A analog scale that can assist while adjusting trim pot or trim capacitors in a device

A alarm that can turn devices off or just make a lot of noise.

A general purpose timer to manually time stuff.
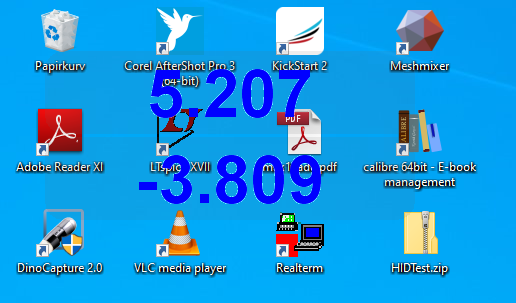
One or more readouts from devices. These popups can be customized to be transparent or not, color and size can be adjusted.
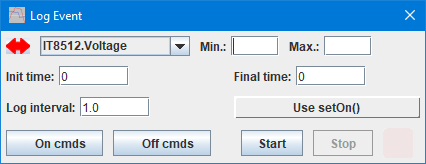
Log data until a specific condition or time, can be used to log battery discharges.

Change 1 to 3 parameters while logging

Change one device parameter with a slider, instead of typing the value in the "Setup popup".
Current values
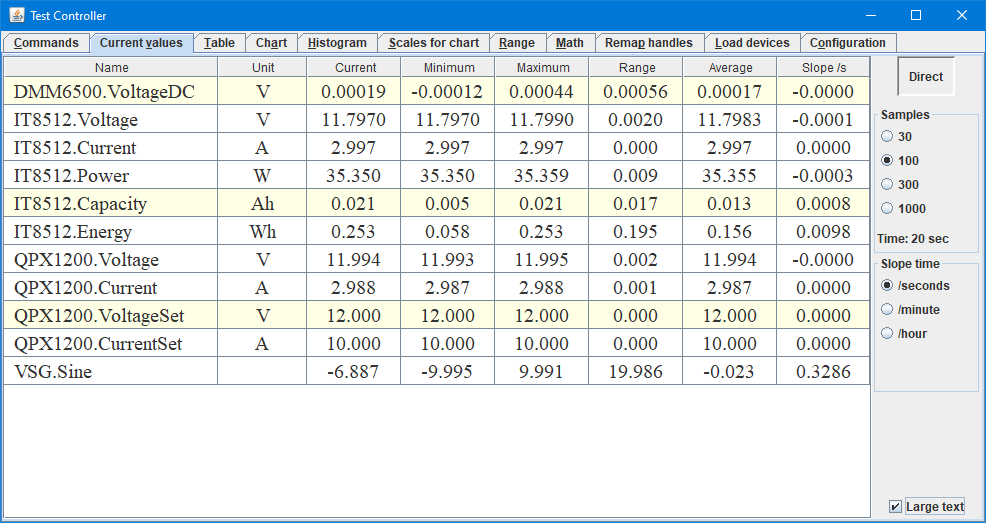
Next page is the current values, when it is selected it will request values from all devices a few times each second and show them.
Some calculations are also done.
Table

This is used for the logged values or for a loaded CSV file. The largest dataset I have tested with until now is 5.5 million samples with 3 devices (The 3 internal), it took 55 hours to log.
There is support for two CSV formats and a TAB format for saving and loading. The export button do also use CSV formats, but allows customizing formats, columns and select part of the data.
Chart

The chart screen is used to view and select part of the data. Any value can be used on either axis and it is possible to use logarithmic scales.

The chart has a cursor that can do a couple of things. It is used to locate and copy position to the two boxes below the chart, this can then be used to zoom the chart and be transferred to some other pages. The cursor works directly on the raw data, not the data shown in the chart, i.e. search functions will work at any zoom.
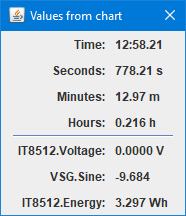
When the cursor is visible a small popup will show the values at the curser.
Scales for chart
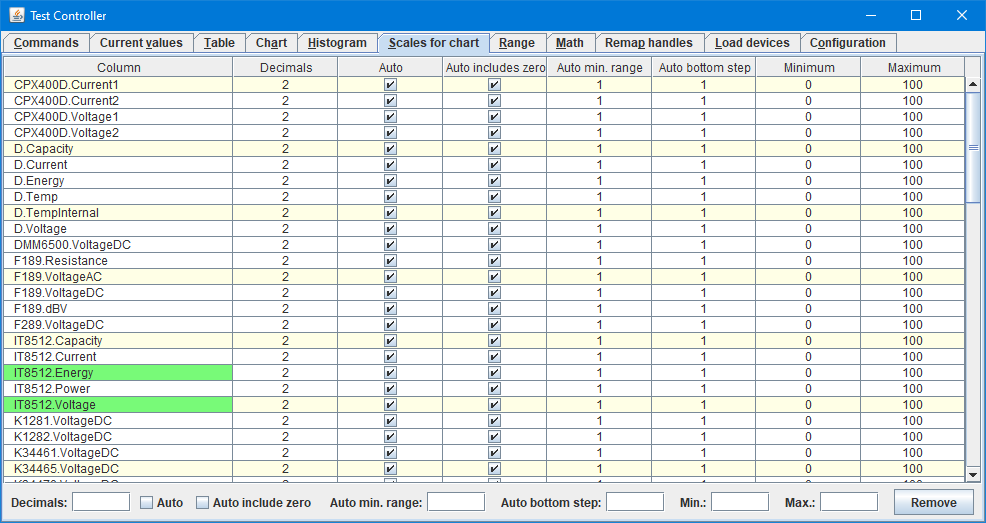
The get the best charts there is a rather elaborate setting for the scale, they can be automatic with some restriction or manually.
Histogram

This shows the distribution of values over a range of data.
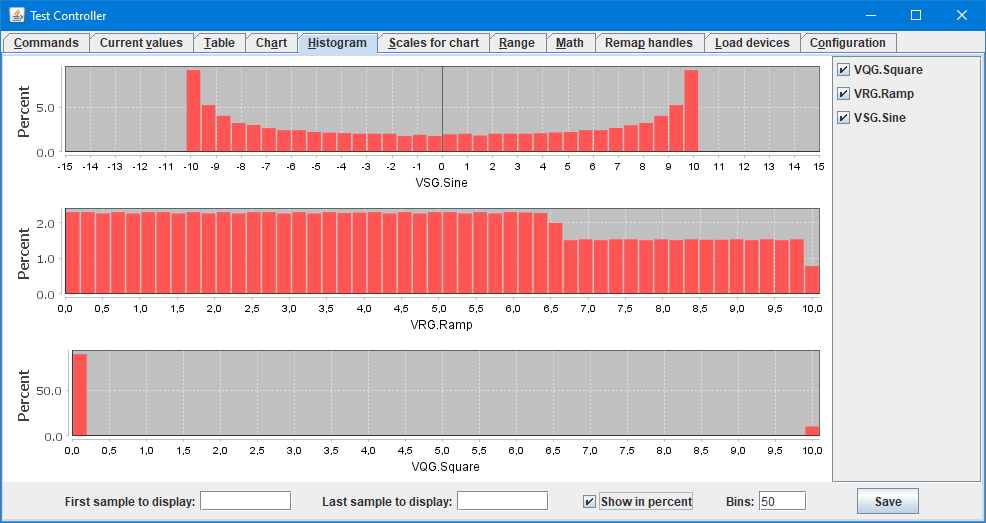
Up to 3 histograms can be shown at once.
Range
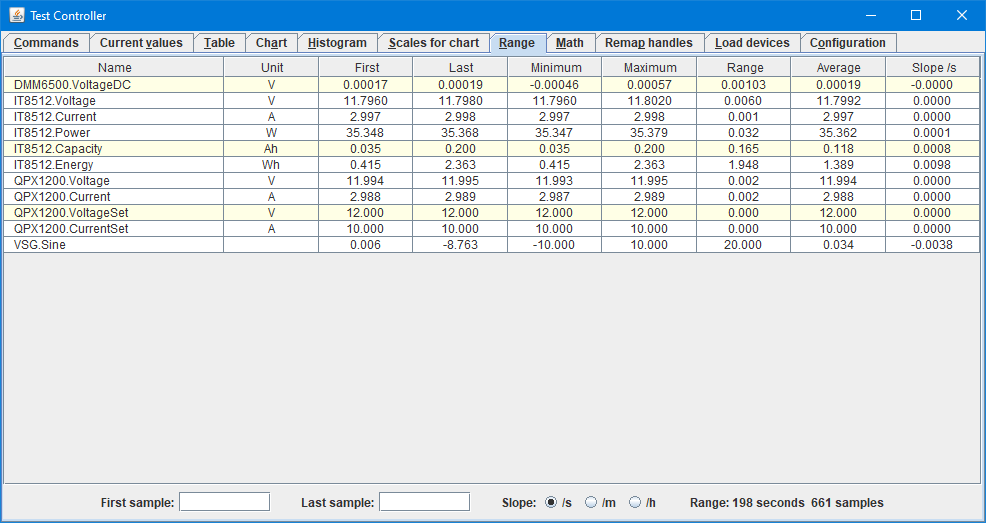
This will do calculations over a range of the data, it can be all the data or a small part of them.
Math
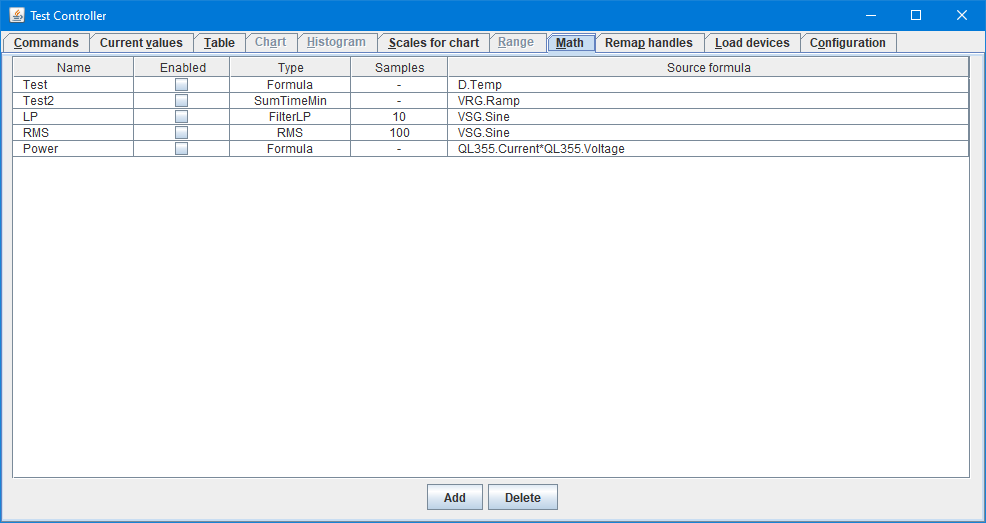
Want Ah, but you only have the current, this page can add columns to the table that is calculated from the other data in the table.
The formula is one or more column names and the standard mathematical operators and functions. The result is then passed to the the type that can sum over time, filter and many other things.
These calculates do also work on "Current values".
Load devices
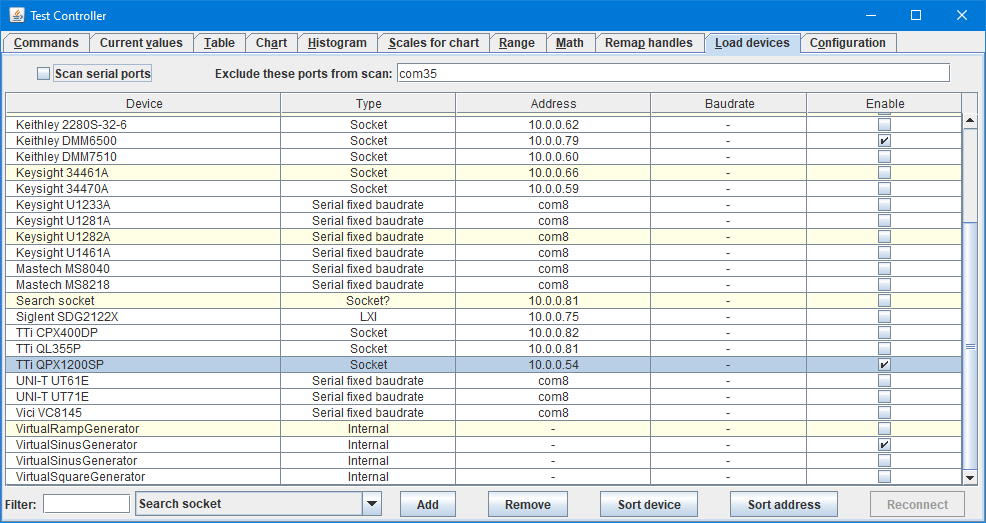
This is the inventory of the devices you have, check the ones that is connected.
All supported devices is found in the combobox at the bottom, add the devices you have to the inventory list.
Generally
Settings are automatic saved to disk, this includes: Math, Remap handles, Load devices and configuration.
Many tables can be right clicked and copied as text that can be pasted into a spreadsheet.
The shown window size is the minimum, the program can scale to a larger window.
Number input to expressions support SI prefixes, i.e. 33k or 4.7n is valid value.
The software is tested on a fairly fast Windows machine with lots of ram where is works very smoothly.
I have also tested with a limited virtual Linux machine on the same computer, doing fast logging is not a good idea there.
Videos
Videos that has something about TestController:
TheDefpom live, this includes a segment about TestController
The start is about the device definitions, later on he shows some remote readout and control for a couple of devices.
Thomas Scherrer playing with a oven controlled oscillator
TestController is used to catch the startup and the regulation/stabilisation of the temperature control.
TheDefpom explains use of his TC implementation of a Siglent power supply.
The video is part of a review of the power supply and after showing the internal computer interface (That is rather bad), he shows TC interface.
Conclusion
I have tested with a lot of different equipment and have added what I believe to be equipment with the same protocol. I have not retested after each change, i.e. some equipment may not work anymore (But will be fixed when I discover a problem).
The software frequently get updates, this can fix bugs or add new functions. New devices are also added to the software.
Adding new devices can not only be done by me, the configuration of a device is a plain text file that is used to configure a device driver (Multiple are included). There are some articles on configuring devices.
Notes & Download
Ideas and bug reports can be send to my email: info@lygte-info.dk (This email can be used for donations)
A discussion thread about TestController can be found on EEVBlog, it is also possible to post ideas and bug rapports there.
Download program Installing and getting started
Anybody with problems please contact my either on EEVBlog or directly on my Email, I want to know about problems and will try to improve TestController to reduce it. Improvements can be better documentation or changes in TestController, but without information about what the problems are I cannot do anything to improve.


